Mynda wrote a post about line charts vs dot plots where one of the steps in setting up the dot plot was to format the series markers, by hand 🙁 .
Not surprisingly we had a few people ask if there was a quicker way to do this formatting, and Mynda volunteered me to write some VBA, so here it is.
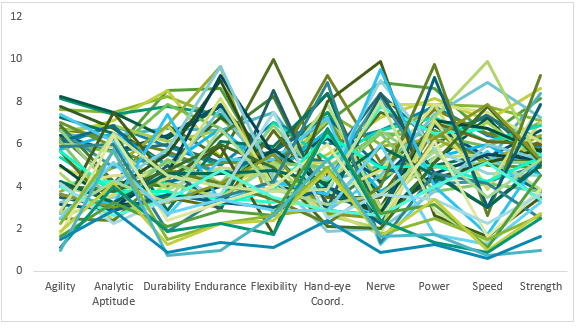
Our dot plot starts life as a line chart with markers
My VBA will
- Remove the lines
- Increase the marker size
- Change the marker color
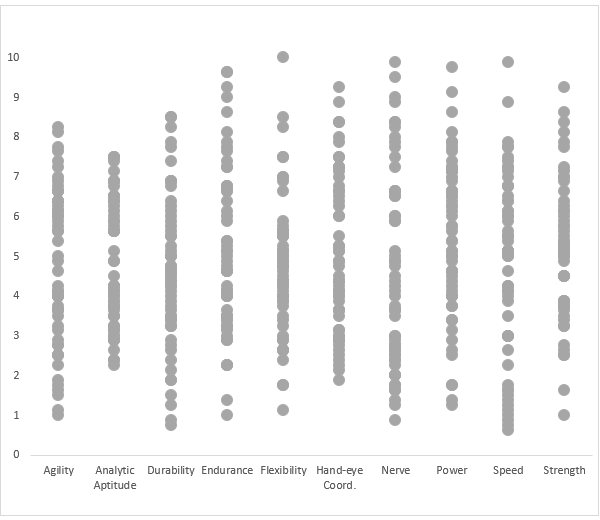
That's over 200 markers formatted in the blink of an eye, the end result being
The Magic
There's not much to the code
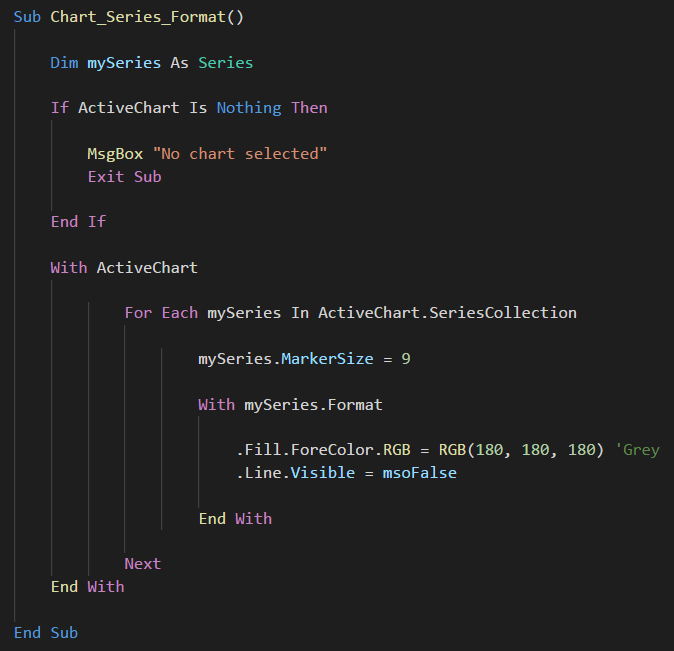
The code acts on the active chart so you must click on the chart you want formatted before running the macro.
If no chart is selected, you'll get an error message and the code will end.
The code should be pretty self explanatory. For each series in the chart, set the marker size to 9, change the fill color, and hide the lines.
Fill color is specified in RGB so you can change this to whatever RGB values you want, but a nice shade of grey or other neutral, light tones will work well.
To get the code to run you can assign a shortcut key to the macro, add an icon to your QAT, or open the macros dialog box (keyboard shortcut ALT+F8) and run it from there. Or open open the VBA editor and run it that way.
Download the Code
On the Pivot sheet of this workbook are a couple of sample charts you can use to run the code on.
Make sure you use CTRL+D to duplicate the chart before you run the macro. This way you'll always have a backup if you want to go back to the original line chart.
Enter your email address below to download a workbook containing this VBA code.

a simple code, so elegant and consequently so useful ……Thanks Philip & Mynda!
No worries Carlos