You can now use Python in Excel natively!
Python runs securely in the cloud, and we write Python in Excel like a formula.
You can load Python libraries to Excel including Pandas, NumPy, Seaborn, Matplotlib and more.
No need to install any add-ins and no clunky separate windows for writing the code.
Note: Python in Excel is currently available to Microsoft 365 Office Insider users on the Beta Channel.
Table of Contents
- Example Excel File Download & Cheat Sheet – Try it out for yourself
- Python in Excel Examples
- Python in Excel Video – Step by Step
- Learn how to use Python in Excel
- Excel Python Function
- How to Import Python Libraries
- Defining Dataframes
- Python Descriptive Statistics in Excel
- Python Plots in Excel
- Generate Code with ChatGPT
- Excel Python Errors & Troubleshooting
- Python in Excel Security
- Shortcuts
- Licensing
Download Python in Excel Example Workbook & Cheat Sheets


Enter your email address below to download the files.
Python in Excel Examples
We can use Python in Excel to create cool charts aka Python Plots, that we don’t have in the Excel chart library:
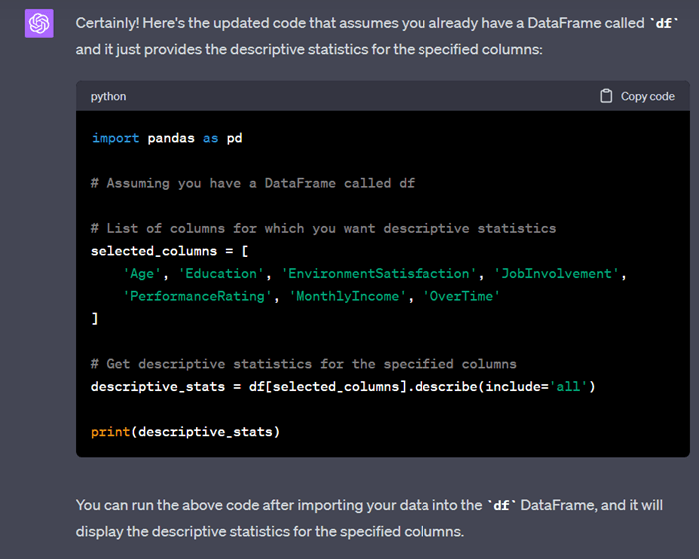
Descriptive statistics are also easy with Pandas in Excel:

And when you use ChatGPT to generate the Python code, you don’t even need to know Python to use it!
It’s still early days for Python in Excel with much development still to come.
It’s also possible that features, icons and menus in this post will change before it’s generally available as a result of feedback while it’s in preview.
Watch the Python in Excel Video

Learn How to Use Python in Excel
Excel Python Function
Python is written in a new Excel function, PY.
Typing =PY then pressing the TAB key, puts the formula bar into Python mode with a green banner to the left:

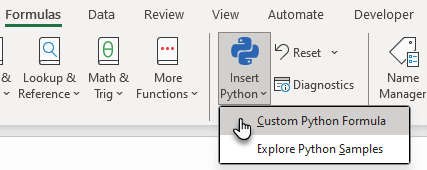
You can also switch the formula bar into Python mode via the Formulas tab > Insert Python > Custom Python Formula:
Python functions are completed with CTRL+ENTER.
How to Import Python Libraries to Excel
[UPDATE] The common Python libraries are automatically available in Excel now, however you can still import additional libraries supported by Anaconda using the techniques below.
To import a library, simply list them by specifying:
import LibraryName as LibraryShortName
For example, in the screenshot below I’ve imported Pandas, Seaborn and Matplotlib:
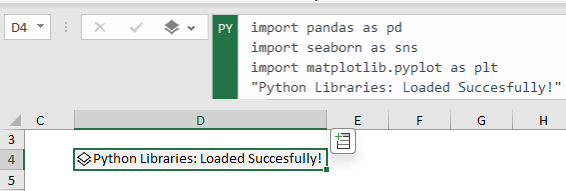
Finish with the text you want to display when the libraries have loaded and press CTRL+ENTER to complete the formula.
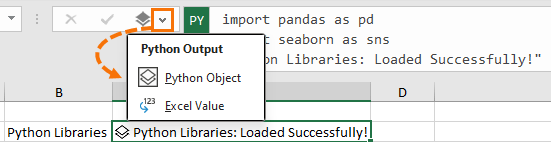
Tip: if the cell doesn’t display the Python Object symbol, choose it from the drop down beside the formula bar:
Defining Python DataFrames in Excel
Next, you’ll want to load your data to a DataFrame.
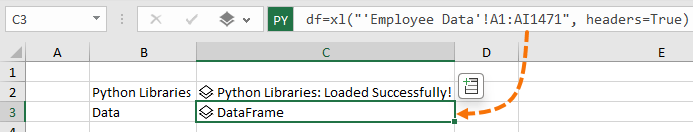
DataFrames are defined with a new function called xl.
To use it, prefix the formula with the dataframe name, this is often simply df:
DataFrameName = xl("cell range", headers=True/False)
In the image below you can see I’ve named my DataFrame df and it’s on a sheet called ‘Employee Data’ in cells A1:AI471:
Note: There is flexibility on how you use DataFrames in Excel, you can refer to them by name e.g.
df['HourlyRate'].plot()
or simply by using the cell reference e.g.
xl("C3")['HourlyRate'].plot()
Tip: You don’t have to place the Python Libraries and DataFrame in separate cells to the Python code, but by doing so, you make them available in other Python formulas in the workbook.
Because Python cells calculate in row-major order (left to right, top to bottom), the Dataframe must be defined in a cell above the cell containing a Python formula that references it.
This concept applies to different Sheets as well, going left to right. Globals also work across different sheets (left to right).
Python Descriptive Statistics in Excel
Now that we’ve imported the Python libraries and defined the DataFrame, we’re ready to analyse the data.
Let’s start with some descriptive statistics using Pandas.
In a cell below the DataFrame cell, I can simply enter a Python formula.
Remember to start a Python formula enter =PY then TAB, then enter the following code:
df.describe()
And CTRL+ENTER to complete it.
Alternatively, if your DataFrame is on another sheet, as mine is, you can reference the sheet and cell containing the DataFrame with the xl function like so:
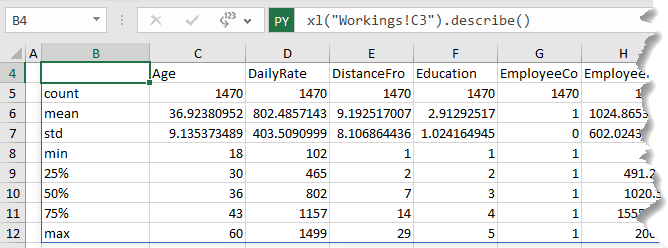
Python returns descriptive statistics for all numeric columns in the DataFrame.
Python Plots in Excel
Charts, or Python plots as they’re known, can be created in a Python formula and the resultant plot is displayed in a single cell.
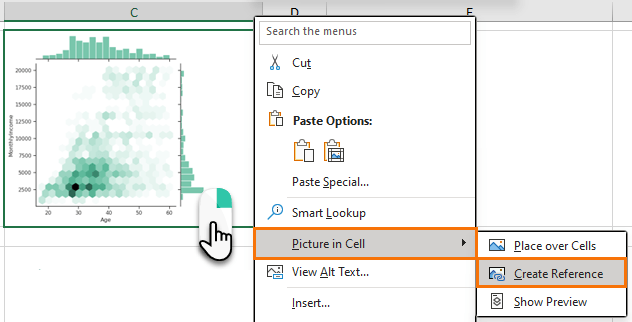
In the image below I’ve created a Seaborn Hexbin JointPlot.
You can see it references the DataFrame with the Age field on the X axis and MonthlyIncome on the Y axis:

Of course, it’s not much use storing charts in a single cell.
We can merge multiple cells to give them more space, but merged cells are a pain.
Instead, it’s better to use the image tools to create a linked picture of the chart that we can move to other sheets in the file:
This picture can then be resized to suit your report requirements or even copied to PowerPoint or Word etc.
For more chart examples, download the file from the link above.
Generate Code with ChatGPT
We’ve looked at using Python in Excel to return statistics and plots (charts), but there are many uses for Python in Excel, but most Excel users like me, aren’t Python programmers.
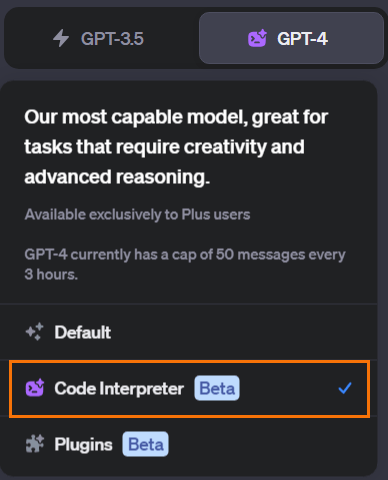
I’ve never written Python code before writing this post. So, I turned to ChatGPT-4 for help.
If you’re not familiar with Python, try using ChatGPT-4 with Code Interpreter turned on:
Or if you don’t have a GPT-4 subscription, you can use Bing Chat in Creative mode:

Excel Python Errors & Troubleshooting
Python cells return the last assignment or last expression. If None is returned, you will see the value 0 or 'None' in a cell.
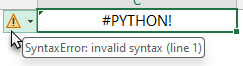
Hovering over the error flag will give you the error in a tooltip:
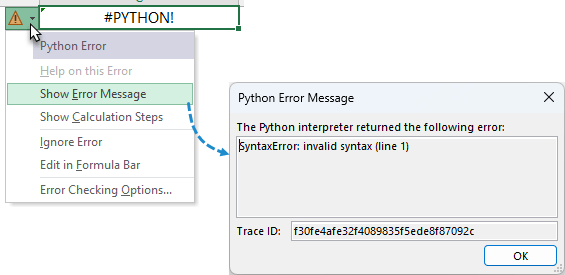
And clicking on 'Show Error Message' returns the error in a popup:
You can also check the Diagnostics pane via the Formulas tab:
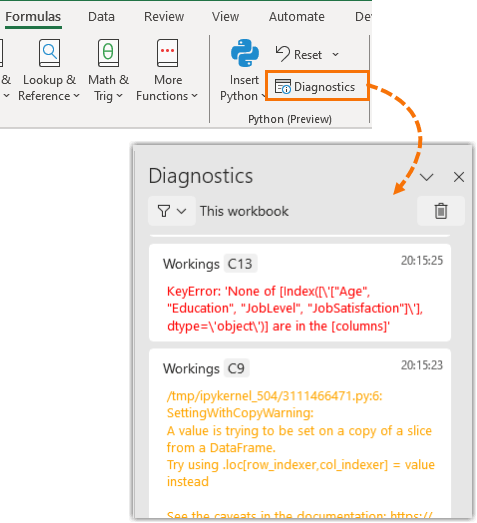
Tip: click the cell reference in the diagnostics pane to go to the cell.
Or try asking ChatGPT or Bing Chat what’s wrong with your code.
Errors you’re likely to experience when working with Python in Excel:
#PYTHON! Likely indicates a syntax error. The diagnostics task pane automatically opens if the #PYTHON! error is returned. Check the diagnostics task pane to see details about the error.
#CONNECT! Means there are issues with the Python cloud service. If you see this error, click the Reset button in the formulas tab or press CTRL + SHIFT + ALT + F9 to restart the Python Session.
#CALC! This error can occur when Excel's calculation engine encounters an unspecified calculation error with an array. Python in Excel calculations can process up to 100 MB of data at a time. Attempting to run a calculation with more than 100 MB of data returns the #CALC! error. Try using a smaller dataset. Or if your dataset is not that large, try restarting the Python session with CTRL + SHIFT + ALT + F9.
#BUSY! Means what it says. Stay patient and it should eventually calculate.
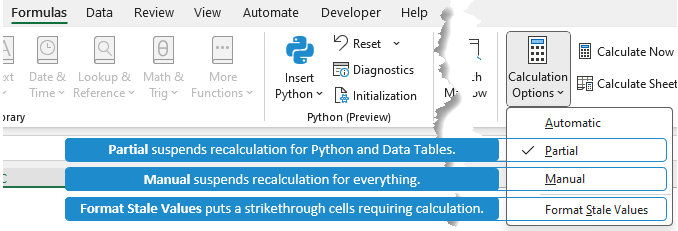
Tip: whenever a Python formula is entered, it triggers all Python code in the file to recalculate.
You may find it better to turn calculation mode to manual or partial while working in files containing a lot of Python.
Format Stale Values will put a strikethrough any cells that haven’t been recalculated:
#VALUE! or #UNKNOWN! typically means you don't have Python in your version of Excel.
#SPILL! There’s data occupying cells the Python values want to spill to. Clear the cells in the spill range.
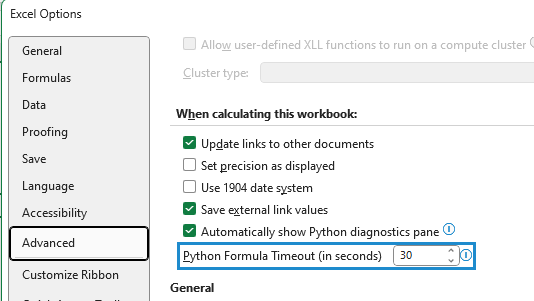
#TIMEOUT! Can indicate a network issue. Try increasing the timeout duration in Excel Options: File tab > Options > Advanced:
Python in Excel Security
In Excel, the Python code is executed within a secure hypervisor isolated container on Microsoft's Cloud, ensuring enterprise-grade security as part of a compliant Microsoft 365 integrated experience.
When opening untrusted workbooks containing Python in Excel, it adheres to Excel's security policies, preventing Python formulas from running in Protected View or with Microsoft Defender Application Guard and isolating them in a dedicated container to avoid interference with other workbooks. In other words, workbooks containing Python are treated with the same caution as opening a macro enabled workbook.
Click here for more details on how Python in Excel security is handled.
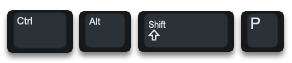
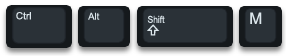
Shortcuts
Everyone loves keyboard shortcuts and with Python comes some new ones you might find handy:
|
Python Mode |
 |
Opens the Python editor in the current cell for authoring Python formulae in the formula bar. |
|
Output Toggle |
 |
Toggles between "Python Object" and "Excel Values" as the output type for Python formulae. |
|
Toggle Formula Bar Size |
 |
Expands or collapses the formula bar. |
|
Edit in Formula Bar |
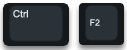 |
Opens the selected cell for editing in the formula bar. If already editing, will toggle between cell and formula bar editor |
|
Edit Mode Toggle |
 |
Switches the editor’s mode between Enter, Edit, or Point. e.g. useful for switching between reference selection and editing. |
|
Commit Python Formula |
 |
Commits the current text as a Python Formula to the cell. |
Licensing
While Python in Excel is in Preview (beta) you will be able to use this feature as part of your subscription.
After the Preview, you will need to purchase an additional license to use it.

Excel is really a dinosaur, or perhaps a Frankenstein, with all sorts of bits bolted on: Excel formulas, DAX, M-code, VBA, Office scripts, and now Python. Truth is, Excel can only handle a limited amount of data (even if you use Power Query), and it’s sloooo….ooow! You’re far better off just using Python (or R, or whatever) to do your data analysis.
I’m not sure what Python in Excel is going to be like. I’ve tried it and find it’ll throw an error for simple code that works fine in the terminal or a normal IDE (eg, adding dataframe column labels with something like df.columns = [‘foo’, ‘bar’]). Maybe, as MS tends to do these days, it’s released an immature product to capture market share and will get around to fixing these bugs later.
There are some Python-based spreadsheets out there that theoretically show a lot more promise than Excel: Mito, Pyspread, Quadratic, etc. But without the muscle and salesforce that MS has, superior products don’t stand a chance. Why do companies still use MS Windows (and Office) when there are free alternatives?
I guess because the free alternatives do not have all the functionality and capacity of Excel. e.g. Google Sheets has limited number of rows, and no Power Query, Power Pivot.
Hi, im getting an unexpected failure as ‘#PYTHON!’. Even the Python sample is not working
Sounds like a bug. Try Ctrl + Shift + Alt + F9, this will restart the python session.
Can not get the Python For Excel Cheat Sheet to download.
Thanks
Hi Sam,
Can you be specific about what the exact problem is.
Does the link not download the cheat sheet?
regards
Phil
One needs a Chrystal Ball to see where this is going. Does one ditch native LAMBDA and LET and switch all calculation to Python libraries? Or would it run like a dog, showing ‘Busy!’ all day? Does one have to master a plethora of libraries or would 95% of the work require one?
I would be sad to see Excel sheets gutted since so much has become possible with native Excel formulas. I suspect my writing a Fast Fourier Transform as an Excel formula was pushing the concept of ‘roll your own’ a step too far now as ‘numpy.fft’ has hit the streets – but I have still to learn how to call it!
Anyway, thanks for the intro, there seems to be so much learning to be done and it is difficult to guess where the highest payoffs will be.
So far in my experience, Peter, Python calculates slower than native Excel functions, so I won’t be ditching much. For me as an Excel user who knows very little Python, I’m excited to use it for charting and maybe some statistical analysis. But for data cleaning and shaping, modelling tasks I’ll be sticking with Power Query and Power Pivot. I’m sure Python experts will prefer to use Python in Excel for those tasks and now they can.
It’s all just awesome.
Incredible computing power within everyone’s reach.
A superb tool for discovering, studying and experimenting with Machine Learning
So pleased to hear you’re excited to use Python in Excel, Jean-Pierre!
You were quick to market with this one! I haven’t seen the new PY function in my Edition yet (although I am on the Beta Channel). Are the new objects and functions callable from VBA do you know?
Hi Tony,
I’m not sure if you can call Python with VBA, sorry.
Check for daily updates to Excel to see if you get Python. They drip feed it so they can check for adverse effects!
Mynda
Thanks for the overview. Just thought I’d share- for Python learning, I found Corey Schafer’s YouTube channel amazingly clear and efficient. The channel was a little bit dormant for a while but it looks like he’s posting again. https://www.youtube.com/@coreyms
Awesome, Jeff. Thanks for sharing.
Pretty cool :0
Indeed, Carlos! Have fun with Python in Excel