With Microsoft 365 we can now include images in Excel PivotTables, as well as built in data types like Stock and Geography, Power Query custom data types and Power BI Organisational Data Types.
This opens up the ability to create dynamic and visually rich PivotTables like never before. When combined with some slick formatting we can create PivotTable reports that look nothing like the PivotTables we’re accustomed to.
The animated image below demonstrates a PivotTable containing images being filtered by a Slicer.
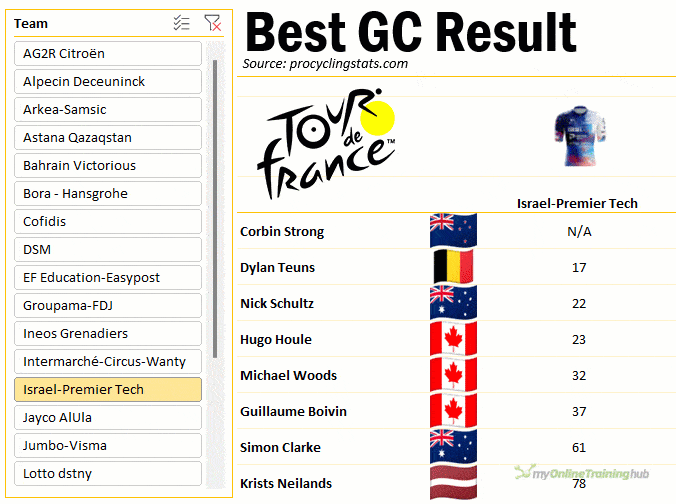
Table of Contents
Watch the Video

Download the Example Workbook
Enter your email address below to download the files.

Inserting Images in Excel
PivotTables can work with images that have been placed in a cell using any of the following techniques:
- IMAGE function
- via a data type: either built in data types, Power Query custom data types or Power BI Organisational Data Types
- via the Insert tab of the ribbon > Insert > Pictures > Place in Cell*
- via the clipboard > Paste > Paste Picture in Cell or right-click > Paste Options > Paste in Cell*
*The ability to paste or insert an image in a cell is currently only available to some users on the Insider Channel. I haven’t won the insider lottery for this new feature, so I can’t demonstrate it yet. In these examples I’ll be using the IMAGE function.
Note: PivotTables can only work with images inserted using one of the 4 methods above. They cannot work with image objects.
Creating PivotTables with Images
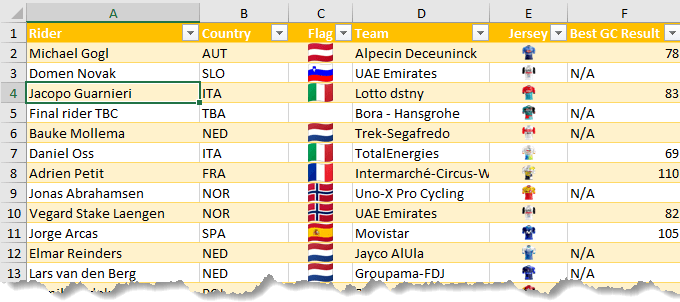
Once you have images in your dataset, like the table I have below for the Flag and Jersey columns:
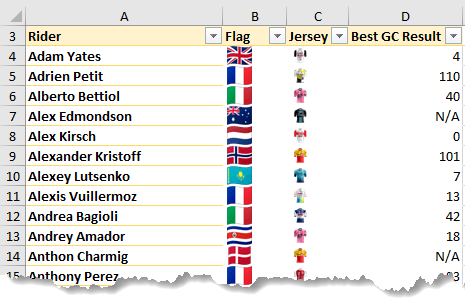
Simply insert a PivotTable and add the image fields to either the row or column labels:
The images will automatically resize to fit the available space in the cell and with some clever formatting, we can create interactive reports like this:
If you’d like to see how I created this report, watch the video above for a step by step tutorial.
Images in PivotTables Limitations
Unfortunately, images do not work in Slicers, yet. Fingers crossed they’re on the to-do list at Microsoft, but I won’t be holding my breath.
And as mentioned earlier, you cannot use image objects. The images must be inserted in a cell. This means users with Excel 2021 and earlier will not have this functionality.
Tables containing images cannot be loaded into Power Query.
Creating PivotTables with Data Types
Another new feature is the ability to create PivotTables from data types such as the built in data types like Stock and Geography, Power Query custom data types and Power BI Organisational Data Types.
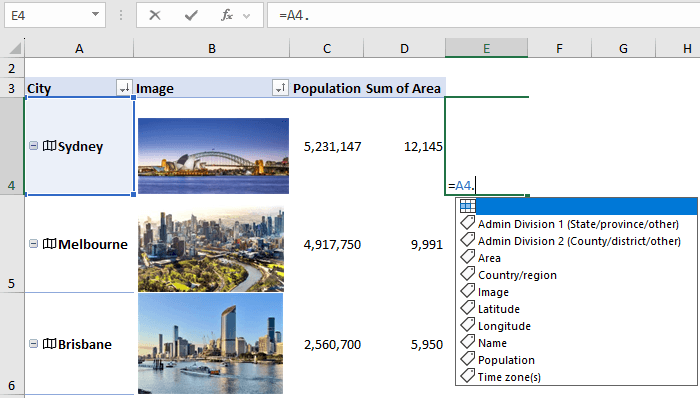
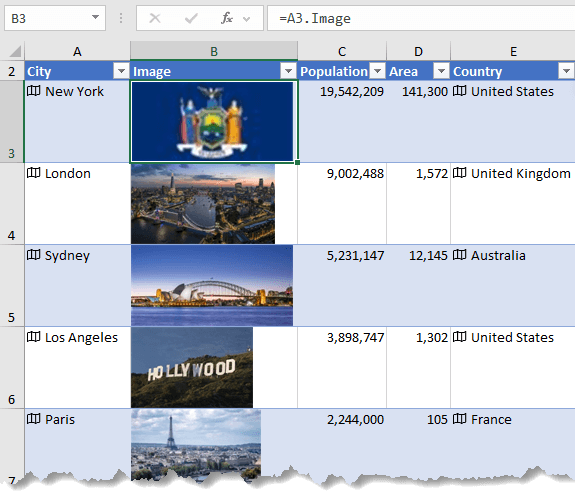
Because data types can also contain images, we can insert the images into cells by referencing the data type, as shown in the formula bar of the image below:
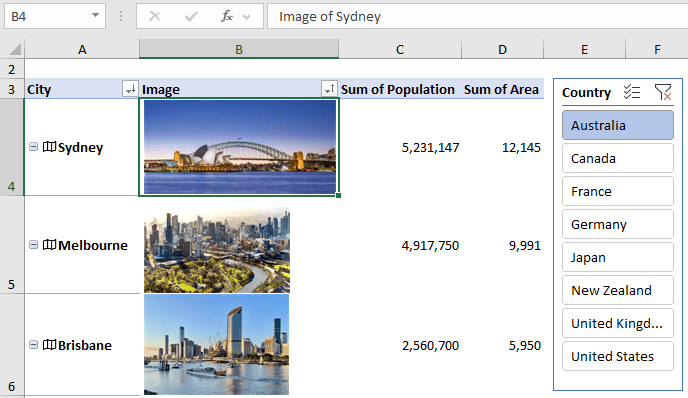
I can then use this table as the source data for my PivotTable and the data type and image are available in the PivotTable:
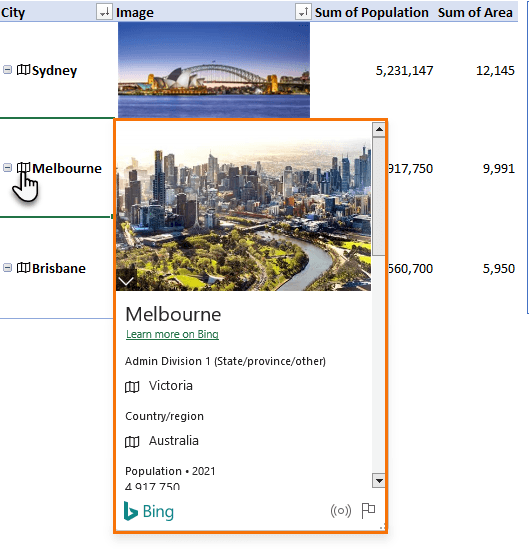
I can click on the data type to see more information about the city:
I can’t add columns to the PivotTable from the card like you can with data types in Tables or cells. However, you can reference the PivotTable cells and extract data: