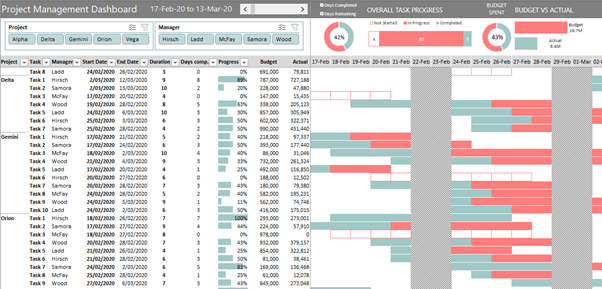
Managing projects or tasks can be improved with a visual representation of progress and milestones.
Thankfully, an Excel project management dashboard like the one below is relatively easy to build, requiring no programming or add-ins.
Download Workbook
Download the Excel file containing the Excel project management dashboard and step by step instructions.
Enter your email address below to download the sample workbook.

Download the Microsoft 365 version of the Excel Workbook Or
Download the Excel 2019 and earlier version of the Excel Workbook
Note: These are .xlsx files please ensure your browser doesn't change the file extension on download.
Watch the Video

Techniques Used
I used several techniques to build this Excel project management dashboard and below you’ll find links to the individual tutorials on those topics:
- Excel Tables
- PivotTables
- COUNTIF and COUNTIFS functions
- GETPIVOTDATA function
- WORKDAY.INTL function
- WEEKDAY function
- Excel Charts
- Slicers
- TEXT function
- Form Controls
- SEQUENCE function
- Conditional Formatting Data Bars
- Conditional Formatting with Formulas
- Custom Number Formats
Learn More
The topics above are a great start, but if you’d like to take your Excel skills further, please consider our courses below:
Excel PivotTable Quick Start – this course will help you overcome your fears and challenges with building PivotTables. It’ll have you up and running in under 2 hours.
Excel Advanced Formulas - I’ve designed this course to get you quickly up to speed with the functions that are going to give you the biggest efficiency gains. Many of the functions are considered advanced, but when you’ve finished the course, you’ll know like I do, that everything is easy once you know how.
Excel Expert Course – This course includes the PivotTable Quick Start and Advanced Formulas course as well as a load more topics covering everything from beginner topics (which you can skip if you already know them) to more advanced topics.
Excel Dashboards Course – A comprehensive course designed to give you the skills to build dashboards for any industry.


5 would be perfection so therfor 4stars.
clearly explained workshops with a nice explanation and advice. and for the record … free!
keep up the good work
Marc
Thanks, Marc!
Hi Mynda, I’ve followed your tutorial and tried the downloaded version both of which have been successful. However, one issue I have experienced in either chart is that when performing a data refresh, the order of task is changed, although they do remain withinside their respective category. I have even tried giving each task a preceding number, i.e. 1.0 task A. 1.2 task AA, 2.0 Task B etc, but the issue still happens. Any thoughts?
Hard to say without seeing your file. You’re welcome to post your question and Excel file on our Excel forum where someone can help you further.
VERY INFORMATIVE
Great to hear, Raymond!
Excellent video very helpful and well set out.
Mynda can you please forward link to download for Project Manager Dashboard having issue with download.
Can you please describe the download issues?
There are 2 links:
M365 – project_management_dashboard.xlsx
and
project_management_dashboard_non_365.xlsx
Right click the link and choose Save target as xlsx (or Save Linked Content as.., depending on your browser)
Parabéns!!!
Obrigado!
You are amazing
Glad you found this helpful, Hesham!
Hi Mynda,
I enjoyed your youtube tutorial on Project Management dashboards and I was really looking forward to building my own but I get very upset trying to use your data from the download file on my Mac, I tried to get both versions, and ended up wasting my time. Would you consider sharing the unedited data file to try. Thanks
I’m not sure what you mean by ‘I tried to get both versions’. The data in my file is unedited. You can simply copy the sheet containing the data table into a new file and start from scratch.
Hi Mynda,
I have mast list of model of machine having number of equipment,accessories, parts and have a same model but there is some parts are included some parts are excluded
So
I want to create a master check list so that (having checkbox)
I can select part which I want in machine
And out out will be consolidated one BOM(bill of material)
Sounds great.
I read the copyright restrictions page but the Control + left click + DELETE command function does not seem to work on a Mac with Monterey iOS
Hi Bertil, I don’t have a Mac, but have you tried Command + Left click, then Delete? Alternatively, insert another shape, select it, go to the Shape Format contextual tab and open the Selection pane. From there you can select the copyright box and delete it.
Dear Mynda,
Thank you.
I just down loaded “Excel Project Management Dashboard”.
Its going to be a great help for me to build up my own dashboard inspired from the example you provided us.
Thank you for your help.
best regards
Sukesh
Great to hear, Sukesh!
Hello,
This is a fantastic resource and I am attempting to use the principles to create my own dash board. The issue that I am running into is that when I try to create the budget vs actual graphs, my values do not change when I select different groups on the dash board.
It sums the entire amount each time and does not vary if I only select “Alpha”. I have watched and re-watched the video and tried it on your workbook but I cannot see what I am missing.
I am wondering if there is a trick that I have missed.
Hi Declan, please post your question on our Excel forum where you can also upload your Excel file and we can help you further.
Dear Mynda,
I am Lilit. I write first to express my strong gratitude for such an amazing job. You are great! I wanted to ask about the data file to be downloaded for the Project Management Dashboard. I cannot find it to start and to develop the dashboard on my own-I see only already built workbook. Please, could you help me and send it to my email ? Also, I want to ask whether you give private lessons?
Thank you for your time and patience.
Best regards,
Lilit
Hi Lilit, great to hear you enjoy my tutorials. The download is in the post above under the video. Please read the instructions on the page for downloading.
i have gone through you dash board, its really nice how you teach to others. im working in on of the liquor company in Bhutan as a marketing and sales. im really interested in learning dash board. through you channel i have learn a lots but sitll then i need you help to learn more..
Glad to hear you found this tutorial useful. Please consider my Excel Dashboard course to learn more.
Hi Mynda,
i love your work. I was wondering if you could guide how to make a project progress s-curve out of the planned and actual data of the gantt chart? I would like to express that in the same dashboard.
Hi Tom, I don’t have any tutorials on this I can point you to, but you might like to check out this post.
Hi Mynda, Thanks so much for the video. I was able to adjust what you’ve done here to fit all but one of my project management needs. I can’t find an answer for my question anywhere online so I’m coming here to see if you might be able to help. Feel free to direct me to a more appropriate forum.
Let’s say I have a target for how many days I expect a task to take (in other words, I have a target end date). What I am wondering is whether I can highlight in red the days worked that go over the target end date/the target # of work days. So for example, if I have a task that was supposed to only take 1 day to complete (start date July 12, end date July 12) but has so far taken 3 days, can I have one color fill for July 12 and a red fill for July 13 and July 14? This will help me quickly see for the hundreds of tasks that are going at the same time which ones are taking longer than expected.
I think this would only be needed for tasks in progress…having the whole bar turn to green (my “complete” color) once it’s 100% complete is fine.
I’ve been doing mental gymnastics trying to figure out how to do this with the conditional formatting but I don’t think I have a good enough grasp on it to arrive at a solution quickly. Thank you so much in advance if you are able to help!
Hi Elna,
Glad the template was helpful. You can use Conditional Formatting with formulas to highlight the dates you mention. If you get stuck, please post your question on our Excel forum where you can also upload a sample file and we can help you further.
Mynda
Brilliant Dashboard.
The techniques shown here are not overcomplicated but very effective and can be used in a variety of workbooks.
Explained so very well.
Very inspirational.
Great to hear you found it helpful, Andrew!
Thanks for the tutorial, Mynda! I’ve found it very helpful.
For an interactive dashboard like this one, is there a way to link the budget lines to a separate Excel sheet? Our book keeping software can export to excel, which would be great to have weekly updates on all sheets with only having to input the information once.
Thanks again!
Hi Matt, you could use Power Query to get your get the data from your bookkeeping software file exports and then either merge it with your actual data, or use Power Pivot to model the data and summarise it in the PivotTable as shown in this tutorial: https://youtu.be/rsx43g7TBBs
Hi, Mynda,
Thank you so much for the amazing inspiration! Based on your video I created my own PM dashboard.
There is just one question left: Is it possible to replace the single dates with weeks?
For example: Your slicer shows single days within a specific range.
I just want to “zoom out” and want to see this view in weeks.
Great to hear, Tome! You can modify the dashboard formulas to display weeks. Each column could show the week ending date and from there you’d need to calculate the week start date and allow for that date range in your formula.
Hi Mynda!
Thank you so much for all the work on this worksheet. It’s great!
I’m trying to make a slight change though – I want to count the start date based on the end date. I know it may be done by inserting a minus ‘-‘ before the days value but I’d need another solution where I don’t have to use negative values (this messes up the progress bar and slows down creating data table).
Could you advise on possible solution?
Much appreciated and thanks again for being awesome 😉
Hi Kate,
I’m not sure what you mean by “count the start date based on the end date”. Please post your question on our Excel forum where you can also upload a sample file to help us understand what you’re trying to do and we can help you further.
Mynda
Hi, Mynda
Thank you so much for the amazing contents!
It’s been extremely helpful.
I have one question, though. I entered my email address, but haven’t received the template file yet. Am I doing something wrong? I received the newsletter only.
Thanks
You’re welcome, Erika. When you enter your email address the download link becomes available on this page. It isn’t emailed to you.
Hi Mynda,
Thank you very much for such a wonderful tutorial. You’ve made my life much easier now that I can build my own dashboard.
I have a question in reference to the date format though. I’m trying to build my own dashboard based on yours but I reside in a country that has its own format and by using the “=workday.intl” formula, the end date isn’t computable because it’s not recognised.
Would you happen to know how I can go about changing it so that it can be computable or do I have to stick with the gregorian format?
Thanks very much
Hi Paul, not sure what you mean by the end date isn’t computable, please post your question on our Excel forum where you can also upload a sample file and we can help you further.
Thanks Mynda,
I’ll do that.
Another question I have is, I’ve tried to copy the formula you used to calculate the progress but the response I get is “The syntax of this name isn’t correct…” error message. I take it I can substitute your formula with the normal percentage formula instead?
Thanks!
Sounds like you haven’t named your table with the same columns as I’ve used.
This is an excellent dashboard and wonderfully taught! Perfect for small companies or projects on tight budgets that cannot afford commercial tools / commercial prices.
Glad it’ll be helpful, Karl!
Hi I really can’t figure out where to get the file to be downloaded. Can you help me out? Thank you!
Hi Riza,
You need to enter your email address. Once you do this, the download link becomes visible and you can right-click > download file.
Mynda
Hi, this excel for project managment is very cool!
I downloaded the file but I cannot change the content of the cells.
Can I use this file for my projects?
Or do I need to recreate a new one from zero?
Thx for ur reply.
Glad you like it, Romeo. You can use this file for your projects. There’s nothing preventing you changing the source data. It sounds like you might be trying to type over cells containing the PivotTable, which you can’t do.
Der Treacy,
Thank you so much for your nice videos.
My pleasure 🙂
Why is progress determined by the days complete/duration? Also is there a way to show that an entire project is completed based on the number of completed task associated with it? Sorry for all the questions, I’m new to using excel.
The days complete value is calculated by the project manager based on their assessment of the progress made. The purpose of this tutorial was to teach Excel techniques you can use for project management, as opposed to how to manage projects, so by all means modify the approach to suit your work practices.
You could add a conditional formatting rule that checks that all projects are complete and then highlight the project name, but how you approach this will depend on the structure of your file. If you get stuck please post your question on our Excel forum where you can also upload a sample file and we can help you further.
Thank you. Does not having the Sequence Function change the formulas needed to make the Gantt bar?
Yes, and you can see that in the Excel file for Excel 2019 and earlier version of the workbook you can download above.
Very impressed by this training…well done. My question is the following, in the gantt chart portion, where you use the conditional formatting, is it possible to provide add a value that could be referenced from the source data. For example, say you had an additional field in your data used to track “# of meetings per day”, e.g. Project Alpha, Task 1, Manager McFay facilitates ‘2’ meetings per day among the range of the start and end dates of that task; I know the example is silly, but trying to use the lesson data for reference.
As you use the scroll bar to select the week, is there a way to:
– show the value of the # of meetings per day in the area of the conditional formatting?
– sum the # of meetings for that day as the slicers are selected?
Thank you and I have subscribed to the channel. 🙂
Hi Miguel, yes, you could use a countif formula to count the number of meetings per day and add that to the conditionally formatted cells. Mynda
Hi, I have uploaded the files but I cannot open them. protection mode.
I’m not sure what you’re referring to as the files aren’t protected.
Hi , where can i get the file?..
In the post above there is a link under the heading ‘Download Workbook’.
I downloaded it. but I can’t open it.
That’ll be something at your end as it’s just a .xslx file without any protection. You could try downloading it with a different browser.
Hi Mynda,
Thanks for a brilliant tutorial 🙂 One question; could the template support switching the timeline between days/months/years? The idea is to support a portfolio overview on a roadmap level (years) and also to enable drill down int the time line say 6 months.
Thanks.
Hi Oskar, great to hear it’ll be useful. I think it would be easier to have 3 separate sheets with your desired time periods and give the user hyperlink buttons to navigate between them.
Hi Mynda,
Many thank for the tutorial, this is really helpful.
Regarding the monthly time period, how would you do to adapt the current template?
Best,
Glad you liked it! To modify for months, you’d need to change the formulas to check between dates using functions like EOMONTH etc. It’s not something I can answer properly here.
Hi Mynda,
Thank you so much for the lesson & template. is very useful. Hope to see more of such video from you.
Stay safe & stay healthy!
Glad it was useful, Eveline 🙂
Hi Mynda,
Thank you for the Lessons and templates. You are a good teacher.
Thanks for your kind words, Farrukh!
Very Informative Video
Glad you enjoyed it, Hafiz!
I found your video very helfull
Great to hear, Sabarish!
Hi, loved your YouTube on dashboards. I have a question you might be be able to help me with.
I like to build a chart that show a pair of parallel lines. These lines change (width between lines) at different part of the progress (flow)…
description on why? I want to monitor production speed with a series of events. at each event the flow of the item though a department (manufacturing process) is calculated and it will show something like a hour glass on it side ? the closer the lines the faster the product is flowing though the department / process and the wider the lines (bottle neck) the slower the flow
we can then add resources or remove resources to the department or process.
I search YouTube and Excel for something like this? but cant find anything suitable
Thanks, John. It sounds like you might be able to use a stacked area chart to create your hour glass on its side effect.
Hi, I have watched your tutorial on the Excel Project Management Dashboard and learnt more about how to use pivot tables.
I would like to use the template that I downloaded, but I am having difficulty in changing the dates across the page. I am using Excel 2016. I tried using SEQUENCE, but this does not work.
I would appreciate if you can assist.
Regards
John
Hi John,
In the video description there is the alternate method for SEQUENCE for those with Excel 2019 and earlier. Here it is again:
For those who don’t have the SEQUENCE function, you can use two formulas instead:
Cell K5: =MIN( start date column ) + output of form control
Cell L5: =K5+1
Copy L5 across columns as far as required.
Mynda
Hello,
I have watched this interesting video on Project Management Dashboard. I am trying to download the file so I can practice but I did not get the link in my email. Please, can you help me out ? I am trying to build my own Dashboard and I really liked your way of presenting the Project Management Dashboard.
Regards
Cedric
Hi Cedric,
The link to the workbook isn’t emailed to you. When you enter your email address on this page and click on the button, the link should appear.
Regards
Mynda
Can you kindly make a tutorial on making Excel CRM as well ?
Thanks
Sure, if you have some CRM data you can share with me. I’m limited by the datasets I can get hold of 🙂
Good morning,
I am teaching myself how to set up a project management dashboard, but am stuck on the date function using the sequence formula. I have Office 2016 professional.
What is the workaround to insert a list of dates with the sequence formula in Office 2016?
Hi Peter,
Excel 2016 doesn’t have the SEQUENCE function. You can use two formulas in place of SEQUENCE:
Cell K5: =MIN( start date column ) + output of form control
Cell L5: =K5+1
Copy L5 across columns as far as required.
Mynda
Hi Mynda,
I watched the video of the “Excel Project Management dashboard”. This is really interesting and useful. I am trying to create a similar dashboard for my use, but in my version of Excel (office 365) look like the “SEQUENCE” formula is not available. Can you please suggest me a alternate option to get the scroll bar working?
Many Thanks,
Mythree.
Hi Mythree, It’s great to hear you’re having a go at this dashboard yourself. You can use two formulas in place of SEQUENCE:
Cell K5: =MIN( start date column ) + output of form control
Cell L5: =K5+1
Copy L5 across columns as far as required.
Mynda
Hi Mynda,
What is output of form control?
Hi Ian, If you watch the video you’ll see when I insert the scroll bar form control that it is linked to a cell that detects the scroll position. This cell is what I’m referring to as the ‘output of the form control. Mynda
Hi Mynda,
Thank you very much for your tutorial!
I am the beginner of excel and using Microsoft Exel 2010, Now it happened to me that I can’t use the formula for the list of the date. I would love to have your suggestion to finish this video!
Thank you so much <3
Thanks Panida. You can use two formulas:
Cell K5: =MIN( start date column ) + output of form control
Cell L5: =K5+1
Copy L5 across columns as far as required.
Mynda
thank you
Thoroughly enjoyed watching this vid on “Excel Project Management Dashboard” MYNDA, away too fast for me hence I requested a download of the Tutorial I hope to receive it via email.
I’ll go thru it a few dozen times to become adept with this powerful presentation. Keep posting more vids like this for us dummies!
Great to know you enjoyed it, Chris. You can download the file from the link above which becomes active after you enter your email address. Please email us if you have any problems. Have fun building your own dashboards 🙂
Hi Mynda Treacy I have used a lot of your site content. Good to know I’m Iranian. I’m sorry that I can’t do anything for your love. I wrote the same for Leila gharani. I’m just getting acquainted with Power Query. And I especially copied all of your posts in this regard. Thanks again
Hi Farshad! Great to know you’ve found our tutorials helpful. If you want to say thanks, please share it with your friends and co-workers. Mynda
Excellence and easy to learn.
Thank you very much.
Great to know you liked it, Noppadol 🙂
I really like this dashboard, i work in the pipeline industry and would love it if you could show how to implement progress on a Linear Foot Level as well as a Day count as we progress different phases in different ways. Would also be great to show earned value and be able to pull information from Project (if thats even possible). Love the tutorials!
Thanks, Mark! I’m not familiar with your industry specific terminology, sorry e.g. I have no idea what ‘linear foot level’ is 🙂 However, I’m pretty confident it can be done in Excel. It’ll just be a matter of applying your knowledge and the Excel tools.
Thank you very much. You are awesome !!
The most beautifull excel dashboard I have ever seen.
Thanks for your kind words, Eneko 🙂
Hi Mynda,
To be honest, I don’t know how you manage to do such a great job every single time. Very well done Mynda!
Question: Instead of having one ‘Data file’ covering all projects, how can we combine multiple sheets
(one against each project) into one master sheet as ‘Data file’ and that should be dynamic. Let’s say, any additional task added in a project must also be automatically updated in the Master sheet ‘Data file’. As you know that circumstances during project life cycle are always changing and there are always requirements of additional tasks.
I have tried to convert data against each individual project into table and then created one master table and tried to link it but unfortunately it didn’t work. The possible answer is through ‘Power Query’ Or there is another way?
Many thanks in advance for your time.
Regards,
Imran
Hi Imran,
Thanks for your kind words 🙂 Yes, Power Query is definitely the way to automate the gathering and cleaning of the various project tables.
Mynda
Hi Mynda,
First of all, congratulations, I really love this tutorial. I would like to ask you if there is another way to do the second part, that is the part with the dates in cell K5. I don’t have the function “SEQUENCE” in my excell version, 2016.
Thanks,
Cristina
Hi Cristina,
I don’t have a free tutorial I can point you to, but I cover a technique similar to this in my Excel Dashboard course.
In the meantime, you can use two formulas:
Cell K5: =MIN( start date column ) + output of form control
Cell L5: =K5+1
Copy L5 across columns as far as required.
Mynda
Thanks a lot Mynda, the using of the two formulas worked!
Best,
Cristina
Can I also get a version of this workbook that works with Office 365, please? It says” This version of Excel doesn’t support running of interacting with form controls.” Please help! Thanks you!
Hi Sam, this version of the file was built using Office 365, so it is compatible. I’m not sure why you’re getting that error.
Mynda
Hi Mynda, I moved the download file from Chrome download section to desktop section and it’s working now. Thank you. Ok, back to the tutorial.
Glad it’s working now, Sam 🙂
Hi,
The downloadable workbook keeps crashing on me. Would you possibly have a version minus the Office 365 functions, as this may be causing the issue? Would very much like to follow along with a sample document while watching your tutorial.
Best regards,
Colin
Hi Colin, sorry you’re having trouble with the file. You’re the first out of 1000s to report this so hopefully it’s only your PC. I’ll email you the file separately.
Mynda
I would like to learn more. Thank you.
Great, please check out my comprehensive Excel Dashboard course here.