![]()

Mynda Treacy
![]()
Get This Free eBook
Work faster and more productively by learning these keyboard shortcuts.
Enter your email address below to get your free copy.
My Courses
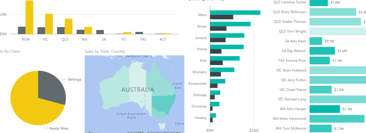
Power BI
Microsoft’s latest business intelligence (BI) & data visualization tool enables you to quickly develop stunning interactive dashboards.
Embed Excel charts, tables, Pivot Tables and dashboards in your Power BI dashboards, then securely share your dashboards to any device.
Course Details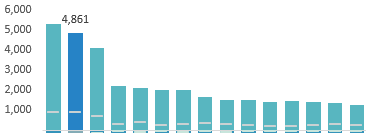
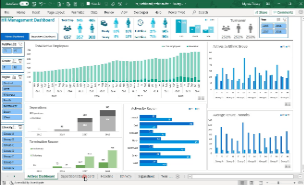
Excel Dashboards
Dashboards provide insight, analysis and alerts by displaying key trends, comparisons and data in interactive reports.
The reader can filter data and change views to find answers to their questions and problems.
Course Details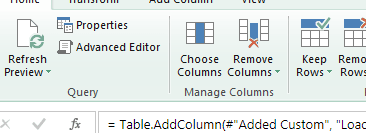
Power Query
Get data from almost any source (a database, the web, Excel, Sharepoint, Salesforce, OData etc), then clean, transform, merge and append data to your query.
Load the data into Excel or Power Pivot for analysis, report preparation or export.
Course Details
Power Pivot and DAX
Import millions of rows of data, create relationships between different data sources, and build interactive reports.
Quickly transform huge volumes of data into meaningful information to get the answers you need.
Course Details
Excel Expert
Designed to take you from zero to hero so you can confidently list 'Advanced Excel Skills' on your resume/CV.
Starting with the essentials, then covering must-know skills like best workbook design, advanced formulas, pivot tables, conditional formatting, macros and much more.
Course DetailsFree Webinars
Watch one of my free webinars and learn how to:
- Build interactive Dashboards in Excel, that you can update in less than one minute
- Use Power Query, Power Pivot and Pivot Tables to build dashboards
- Build dashboards in Power BI with Drag & Drop navigation. Allow users to cross highlight, filter and drill down to lower levels and underlying data


