The Excel FORECAST function uses the least squares or linear regression method to forecast future values. For example, sales, stock requirements, trends etc.
Note: In Excel 2016 this function has been replaced by the FORECAST.LINEAR function as part of the new library of forecasting functions.
Excel FORECAST Function Syntax
| Syntax: | =FORECAST(x, known_y’s, known_x’s) |
Excel FORECAST Function Arguments
| Argument | Description |
| x | This is the next data point that you want to forecast. E.g. it might be a date, or period |
| known_y's | The range of cells containing your historical values you're basing your forecast on |
| known_x's | The range of cells containing the periods you already know |
Notes:
- All arguments are required.
- The known y's and x's must contain the same number of data points.
- x must be a numeric value, otherwise the #VALUE! Error will be returned.
- The #DIV/0! Error will be returned if the variance of known_x's equals zero.
Excel FORECAST Function examples
Let’s take some sales data for 2017 that we’d like to forecast for the first 6 months of 2018. In a separate column I’ll insert my FORECAST function:
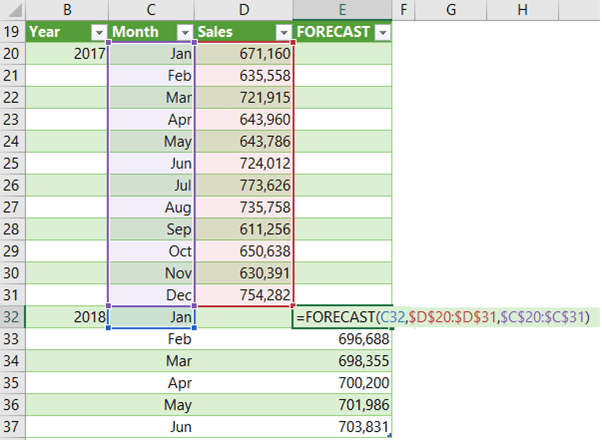
Notice the ‘x’ argument cell reference is relative, so that when I copy the formula down it picks up the next date and so on. Meanwhile the known_x and known_y references are absolute.
BTW, the month names in column C are actually dates formatted to display the month name, thus satisfying the requirement that x values must be numeric.
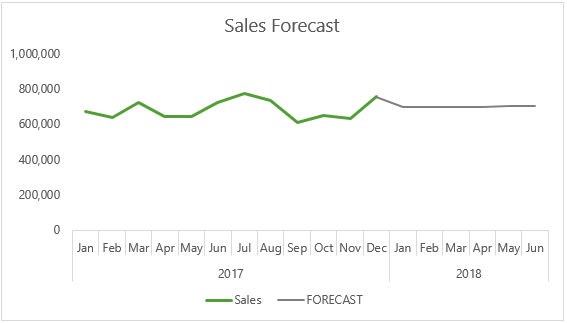
Chart Forecast Data
You might wonder why I entered the forecast in a separate column, and the reason is so that I can plot it in a chart as a separate series, which allows me to colour the forecast part of the line different to the actual sales line:
Download the Workbook
Enter your email address below to download the sample workbook.