The Excel FORECAST.ETS.CONFINT function is new in Excel 2016. It returns a confidence interval for forecasted values, and is designed to be used in conjunction with the FORECAST.ETS function to help you get a feel for how accurate your forecasts are.
It's one of many new forecasting functions introduced in Excel 2016 as part of a forecasting suite, where functions are designed to work together.
Excel FORECAST.ETS.CONFINT Function Syntax
| Syntax: | =FORECAST.ETS.CONFINT(target_date, values, timeline, [confidence_level], [seasonality], [data_completion], [aggregation]) |
Excel FORECAST.ETS.CONFINT Function Arguments
| Argument | Description | |
| target_date | This is the next data/time that you want to forecast. | |
| values | The range of cells containing the historical values that your forecast will be based on. | |
| timeline | These are the dates/times that your 'values' relate to. They can be date/time or a number. This range must be the same size as the Values range. The timeline must have a constant step between the points. Duplicate points can be handled in the aggregation argument, but it's more accurate if you aggregate them yourself prior to forecasting. | |
| confidence_level | An optional numerical value greater than 0 and less than 1, indicating a confidence level. For example a 95% confidence level implies that 95% of future points fall within this radius from the prediction. The default value is 95%. | |
| seasonality | This is a numeric value depicting the length of seasonal pattern. The default is 1 which means Excel will automatically detect the seasonality. 0 indicates no seasonality, which will return a linear forecast. Maximum supported seasonality is 8,760 (number of hours in a year). Any seasonality above that number will result in the #NUM! error. | |
| data_completion | Although the timeline requires a constant step between data points, FORECAST.ETS.CONFINT supports up to 30% missing data, and will automatically adjust for it. 0 will indicate the algorithm to account for missing points as zeros. The default value of 1 will account for missing points by completing them to be the average of the neighboring points. | |
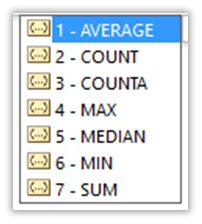
| aggregation |
|
Excel FORECAST.ETS.CONFINT Function Errors:
- Excel returns the #NUM! error when the target date is chronologically before the end of the historical timeline.
- If a constant step can't be identified in the timeline, Excel will return the #NUM! error.
- Excel will return the #NUM! error when the seasonality value is zero or less, or 1 or more.
- Likewise, if your confidence interval value is zero or less, or 1 or more, Excel will return the #NUM! error.
- If timeline contains duplicate values, Excel will return the #VALUE! error.
- Excel will return the #N/A error if the ranges of the timeline and values aren't the same size.
Excel FORECAST.ETS.CONFINT Function examples
Typically, you’ll use the FORECAST.ETS.CONFINT function in conjunction with the FORECAST.ETS function to calculate the upper and lower confidence intervals for your forecast.
In the example below, you can see in cell E39 the FORECAST.ETS.CONFINT is added to the forecast value in column D:
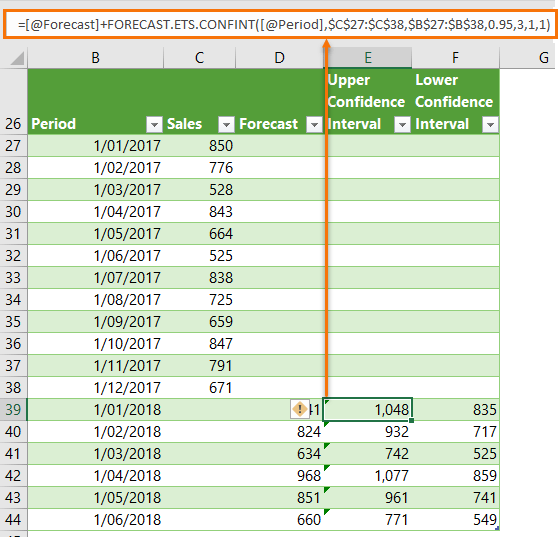
Note: The formulas above use the Excel Table Structured Reference, [@Forecast], to pick up the Forecast values in column D.
When using FORECAST.ETS.CONFINT in conjunction with other FORECAST.ETS functions, ensure the arguments are consistent, e.g. seasonality, aggregation etc. should be the same in all functions.
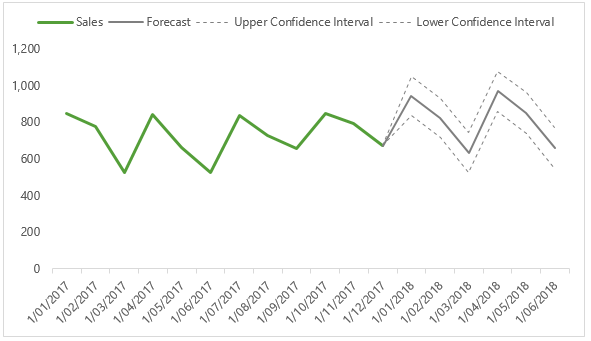
Chart Forecast Data
Of course, the real benefits of tabling this data is realised when we visualise it in a chart:
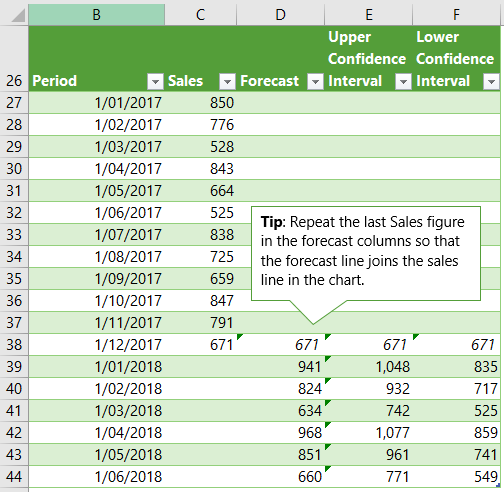
Tip: Make sure the last Sales figure is repeated in the Forecast column (in cell D36 in this example), to ensure continuity in the chart line:
Download the Workbook
Enter your email address below to download the sample workbook.
Related Functions
FORECAST.ETS function - Forecasts future values based on historical data using Exponential Triple Smoothing and machine learning.