Hello -
I have a chart which I've formatted in a very particular way, including the:
- Axes
- Axis titles
- Chart titles
- Data labels
- Data table
- Error bars
- Gridlines
- Legend
- Trendline
Is there a way in VBA to cycle through all these chart elements and enumerate the values for each and all of their settings, such that back color, dash styles., etc.?
What I'd like to do is have a button that causes the report to reformat the way I like it with the click of a button, just in case Excel misbehaves. So I want to cycle through the report and reset everything the way I like it.
Thanks
Hi Shawn,
It would be a complex code.
The easiest alternative is to save the chart as a template, right click the chart and select Save As Template, then when you need to reapply the formats, right click>Change Chart Type>Templates, your template should be there to select.
You can record a macro for this to reuse, here are the methods for this:
.SaveChartTemplate
.ApplyChartTemplate
I wasn't familiar with Chart Templates before, so that was a helpful answer. However, it seems that they are saved as separate files and that's not practicable for me since they would then have to be distributed to users along with the main workbook. Still, I appreciate learning something new.
How complex? What would the pseudo code look like?
There is nothing indicating what chart type it is you are using: is it a normal chart? is it a pivot chart?
Only a pivot chart does not keep formatting in specific circumstances, describes here with a workaround: https://peltiertech.com/pivot-chart-formatting-changes/
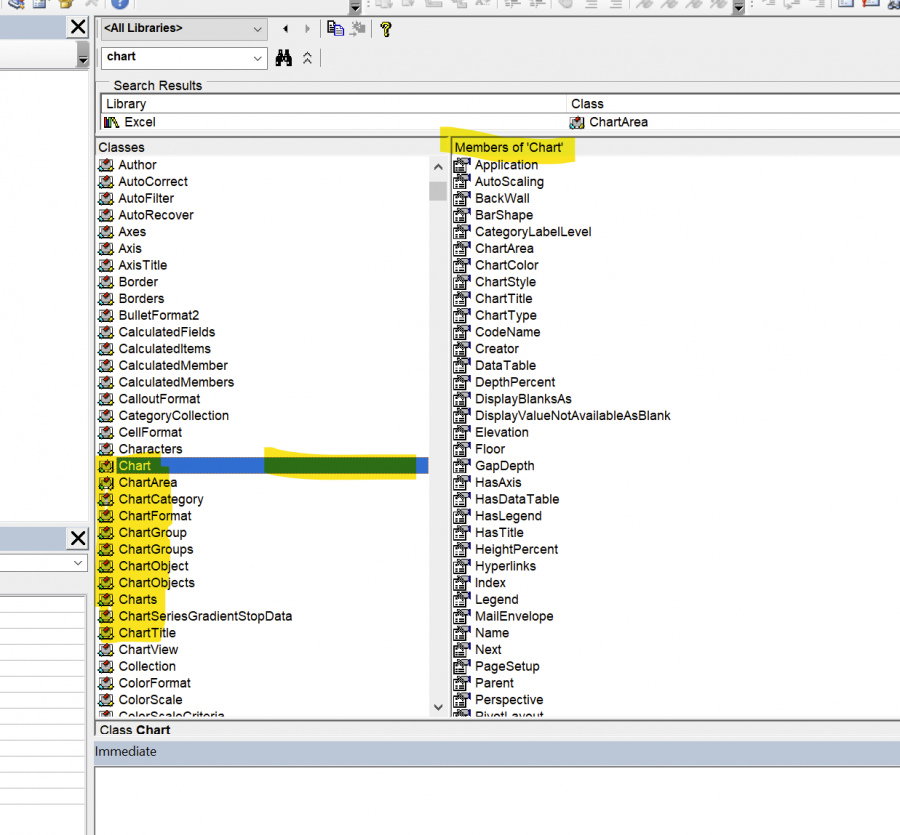
You can take a look into the Object Browser:

A chart is a complex object, lots of methods and properties.
I would record a macro while making the changes in the areas that must be updated, that will give you the base code as a starting point.
Thank you, as always.
