Hi
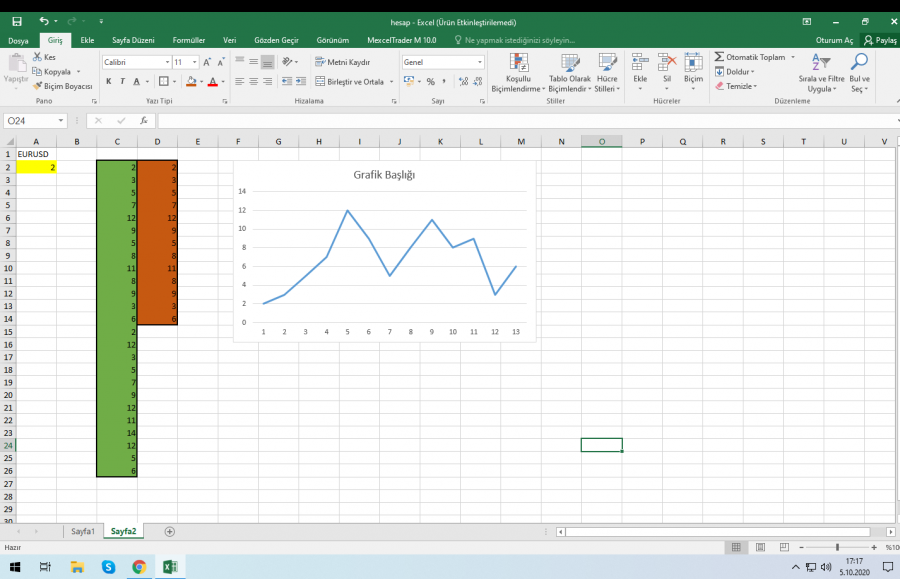
I have a cell on my worksheet that changes. I want to plot every new data.
Below yellow cell is the live data.every last data from the cell should be saved in the green section and the last 20 data should be plotted on the graph.
I have tried many things but could not make it.
Thanks in advance.

Hi,
Please attach your workbook.
Have you tried using the code in this blog post
Regards
Phil
B2 cell is the real time data. I want to get changed data under K column and get the last 30 data under the L column so I can get L column in to a chart.
I have tried your sample codes but it did not work out for me. Sorry I am not an expert maybe I am doing so many things wrong.
Hi,
I don't know if you have dynamic arrays (available in Office 365) so I've written a solution that doesn't use them - see attached.
The chart plots the data in Column N. Bid Price changes in B2 are fed into L2 with existing data in Column L moved down 1 row.
Col L holds all previous prices, with the most recent 34 prices copied to Col N.
The chart plots 34 data points which is what you had in your example but this is easily changed to whatever you want. Just right click on the chart -> Select Data.
Regards
Phil
Column L does not get the data from B2 cell.
Not sure what you mean, you'll have to be more specific.
In the file I supplied, the value entered into B2 gets copied to L2 and then N2 for plotting.
Have you enabled macros when you open the file?
Regards
Phil
Thanks for your help. I have fixed my old issues. But this time my pc freezes because of the too many data traffic(live data cell > column>reverse column>chart). Is it possible to check live data every 2 secs ? so I can put more data and escape from the PC frezees.
Hi,
You can't tell Excel to only check for changes every x seconds. If you are using worksheet change events like this, they will trigger when the sheet changes.
Maybe you can throttle the MeXcel Trader plugin to only insert data on the sheet every 2 seconds?
Phil
