Hello,
I need your help.
I'm creating a Project Management Dashboard (based on a Mynda Excel from Learning Computer Science | Brilliant.org - Build Skills in Math, Data, and Computer Science (youtube.com)
I'm seeing all relevant task information.
![]()
I would like to know how I can see the same information per milestone or project when I collapse all Milestones/Projects (or one project).
I mean.
![]()
Thanks.
Hi Boris,
When you collapse a field, only fields from Values section of the pivot table will be aggregated according to your settings (Sum, Average).
Not those fields from Rows/Columns sections of the pivot table. In your image, they all look like Rows section fields. (only those have a column filter)
Hi Catalin,
Thank you for the answer.
How can I add the Sum of from Values sections?
Hi Boris,
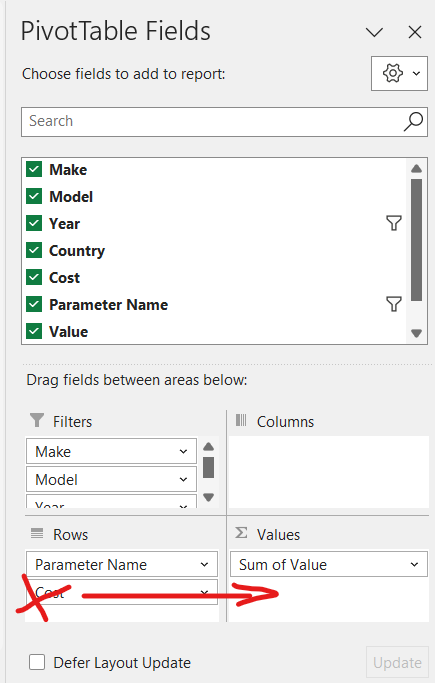
Move the fields that should be aggregated from Rows section to Values section, as in the image attached:

Thank you Catalin.
