I have been using pivot tables for a bit and they are time saving at times.
I have a database of projects their budgets and costs. I know that I can create custom subtotals and custom calculated columns, but was wondering if i could add a line underneath a subtotal to do a calculation e.g. i have one budget for the whole project but several categories of expenses. So I need to show the breakdown of expenses and at the end sum of it and then a new line showing the value of surplus or deficit. Another thing I just noticed, if I added it to a data model to create a measure and check the variance, I am not able to choose custom subtotals I would prefer to do it without VBA, but if it is a must, why not
I hope I can find a solution as otherwise will have to do it manual for above 50 tables![]()
Hi Ahmad,
You should not add custom rows in a pivot table, this is not just unusual but also not recommended, even if there are some workarounds.
Instead, you should have a table with those calculations, and add this table with a relationship to the parent table with expenses.
Hi Catalin
thank you for your feedback. Just to make sure we are on the same page, what i meant by adding a row was a summary stat under the subtotal, do I make sense?
if there is a way, would appreciate altering the file i attached or even create a new one
Hi Ahmad,
Custom rows are possible, you can take a look at these posts:
https://storybi.com/2022/04/09/subtotals/
Can you create please a sample of the desired result, with normal excel formulas in a range, instead of pivot tables, so I can see exactly what you're after, including your formulas?
Thank you
thank you for this Catalin. I will have a deeplook at the links you attached. They look promising and need a bit of work
attached is a sample below the row data
Hi Ahmad,
Building a data model needs a properly organized data.
For example, the budget seems to pe Per Project, not per expense, so repeating the budget at each row in the fact table is not right. It makes more sense to have a dimension table for budget per project.
You can use measures that are calculated only in the totals and subtotals areas:
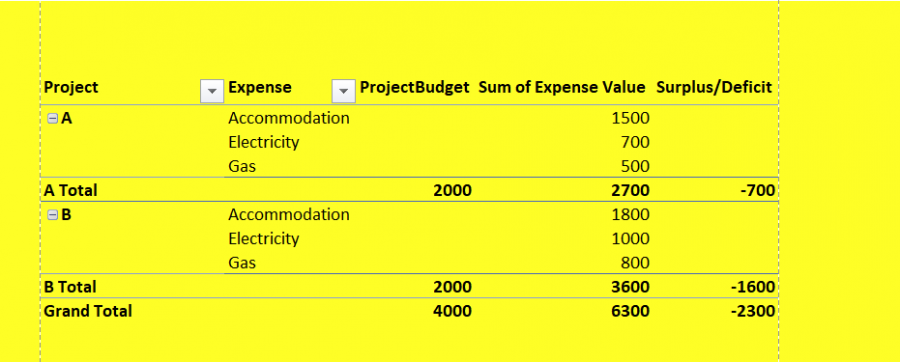
Surplus/Deficit:=IF(COUNTROWS(VALUES(Table1[Expense]))>1,[Sum of Budget 2]-[Sum of Expense Value 2],BLANK())
Looks much cleaner than another custom row, IMHO:

Thank you for this Catalin; this makes sense although different than what I imagined; I like it
there is no way to add this below the subtotal line? instead of adding an extra column????
![]()
See image attached, you still have a few ways to customize the pivot using default tools.
