Hello,
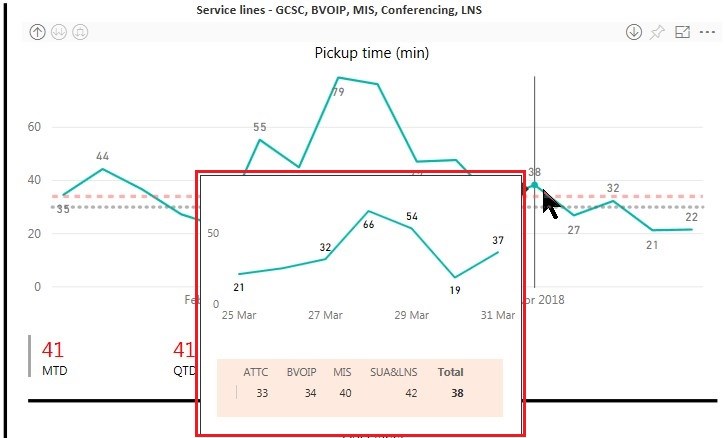
I've been asked to research how to implement a visualization which gives a 'floating' mini chart display when hovered over a line chart. In the attached screen shot example, from a live report, note the small chart highlighted in the red box.
Since I only have view access to the report, I am unable to interrogate its visualization settings.
Thank you.
Hi Mark,
That's a Report Page tooltip. The feature is still in Preview so you have to enable it in the Options for Power BI Desktop.
Mynda
Many thanks again, Mynda!
You're beginning to make me look like a BI Hero around my office 

Mark.
🙂 only you can make yourself look like a BI hero, I simply encourage and point you in the right direction. You have to put in the hard work 🙂
Hi Mark,
Check out this video on Tooltips from the Youtube channel A Guy In A Cube: https://www.youtube.com/watch?v=URTA7JZsAtw
I definitely recommend subscribing to these MS guys, they put out lots of really good videos on Power BI.
Cheers
Mark
Hi Mark,
A veeeery belated big THANKS for your response. I had not spotted it earlier. Yes I very much like and relate to the way the Guy in a Cube guys explain things. They are excellent.
Thanks for the tip, and I have subscribed!
Regards,
Mark.
