Hi Mynda,
I'm trying to create bins for the resulte of a measure. In this case, I would like to like to see a list of the customers who has a gross profit in percentage in each bin.
<=0%
>0% <=30%
>30% <=50%
>50% <=70%
>70%
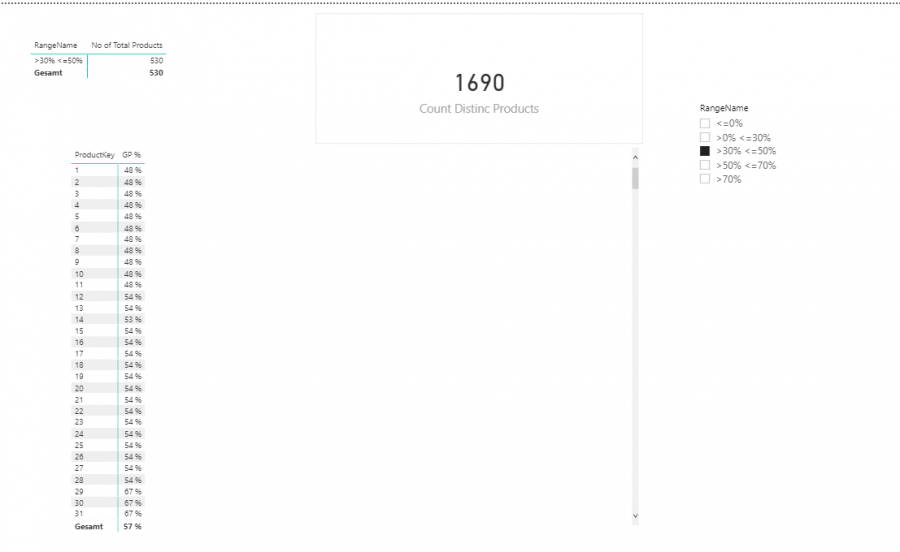
I coud´nt upload the pbix sample file since it seems to have a big data size. I used the Contoso Sales sample file and I trying to test it a the product level. Here two Screenshots.
I created a Disconentect Table wih the ranges and a measure as follows:
No of Total Products = IF(HASONEVALUE(BinSelect[minValueRange]), COUNTROWS(FILTER(DimProduct,[GP %]>=VALUES(BinSelect[minvalueRange])&& [GP %]<VALUES(BinSelect[MaxValueRange]) ) ), COUNTROWS(DimProduct) )
The count seems to work but how do i get to show which products are under this bin?

Thanks in advance for your help.
Regards,
Maria
ps: can you see the images? i got constantly the following message after making the post
Unable to save
This post is rejected because it contains embedded formatting, probably pasted in form MS Word or other WYSIWYG editor
Hi Maria,
The WYSIWYG error is caused when you copy and paste text into the forum from another application, like Word. If you want to paste text, you need to click the clipboard icon with the 'T' on it and paste into that dialog box.
Your error isn't clear. At the beginning you say you want to see a list of customers in each bracket, but then you say you want to see a list of 'products under this bin'. In your second image (sample-4) you haven't shown a table with the bin (RangeName) and ProductKey. What happens when you add the RangeName field to the table with ProductKey and GP% in sample-4?
Mynda
Hi Mynda,
I am sorry that I did not express myself clearly. At work I received a request to create a list of customers with the mentioned GP% intervals as a filter. For this Purpose, I simply took the Contoso sample file to try to recreate the request, but with the list of products. And that's fine, because I know I´ll need to create the same list but at the product level.
I tried what you said, to put the RangeName field in the table, but it seems like it is not working at all.
Here is the link with the sample file: https://we.tl/t-eCgd1ghwca?src ="dnl"
Please let me know if it worked.
Thanks a lot for your help.
Regards,
Maria
Hi Maria,
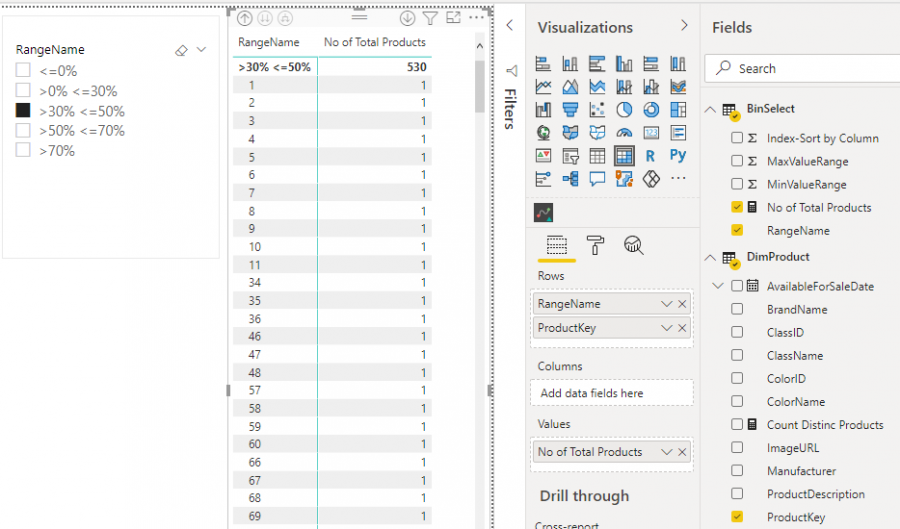
Thanks for the file. Create a matrix table with RangeName and ProductKey in the Rows and No of Total Products in the Values. Then you can click the pitchfork drill down button at the top of the visual to see the product key by bin. You don't have any products in the first two bins because the lowest GP% is 47%.
This is the equivalent of your customers list by GP bin.
Hope that is what you were after.
Mynda

