I created a Gantt chart pivot table with six slicers and a timeline. Everything works but the data in the slicers is greyed out. The slicers function, but I cannot determine what values in the slicers have been selected. I originally created the Gantt chart on Excel 2019, I have also tested on Office 365 and have the same issue. The issue showed up when I added the sixth slicer but does not go away if I remove the slicer.
In the attached picture, the first slicer is filtering the latest schedule version, the timeline is filtering a three-month period, and fourth slicer is filtering out completed activities.
The second picture is how the slicers are formatted when working properly.
Maybe a picture tells 1000 words but without a sample file to determine what you're doing, well, that's a different story
Suggest you attach a sample file with non-private data
The file should be included with this update. Also narrowed the issue. When the measure "Gantt_Field" is added to the pivot table, the slicers change. Below is an image of the pivot table and the measure.
Well, it seems the file is 'greyed-out', no just kidding, it's not even there just two images
Ok. I believe the file was too big. Compressed and re-uploaded.
I see what you tried to achieve, so much is clear.
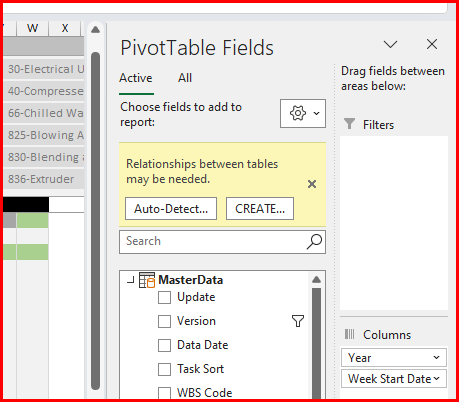
When I open the file (Excel 2021) I get the error message that a relationship between tables may be needed; I clicke Auto-Detect this it gets done and then the slicers are no longer greyed out but the 'Gantt' bars are no longer there and do not 'reappear'.
What I think is the fact that since the Gantt section does not make part of the Pivot table it disables the slicers.
I don't have an answer for you and will have to play aroound and see what happens.
I checked and what does indeeed surprise me is that the slicers are greyed out but do work as intended
I could not resolve why the issue happens when I use values in the pivot table based off of a measure. But, I did find a different way to create the data needed in power query. This allows the use of real data in the value section of the pivot table and the slicers work as designed. Here is a link to how to generate a list of dates between two date values in power query.
