Notifications
Clear all
General Excel Questions & Answers
2
Posts
2
Users
0
Reactions
153
Views
Topic starter
Hi,
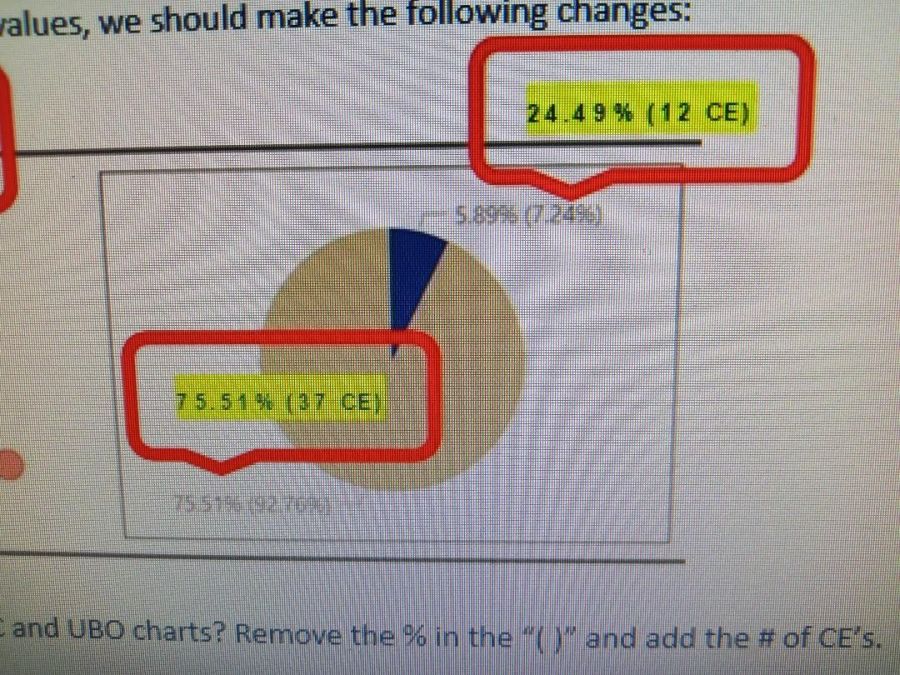
I'm creating a pie chart and I need to show in the labels the source of the percentages came from.
The pie graph will only consists of 2 cuts only 1 for complete and incomplete which are sourced from my excel.
Now the other 2 columns in my excel must also show as well but only as labels. Please see below on how it should be look like:

Posted : 31/01/2023 4:20 am
select the labels and ctrl 1 > click the little bar graph icon and under label options you will have a check box of label options, choose value from cells and then select the cells that you want to show in your graph. Hope that helps. 🙂
Posted : 31/01/2023 12:52 pm
