Just love your infographic shark chart in the sample file.
That gave me a thought, is it possible to make a bar chart or an in-cell chart using pictures?
Else I need to learn more how to use picture editing tools. 
Br,
Anders Sehlstedt
Hi Anders,
Yes, it's not too hard to make a bar chart using pictures.
First get a small picture that you want to use in the chart. Here I have used one called fish.jpg [there's plenty of free clip art on the web], and attached an Excel workbook made with it.
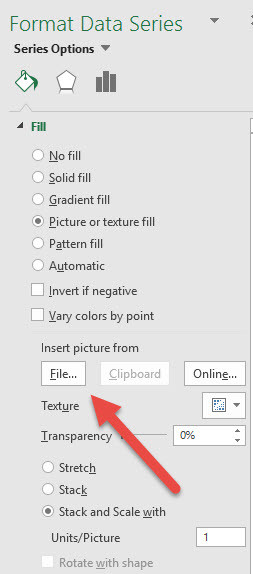
When you have made a chart, click on the data series and use the Format Data Series in the Chart Tools.
The important part here is to select 'Picture or texture fill and then point to the small picture file to insert.

By experimenting with the attached, you'll see how you can get different effects by working with the Stretch, Stack and Stack/Scale buttons.
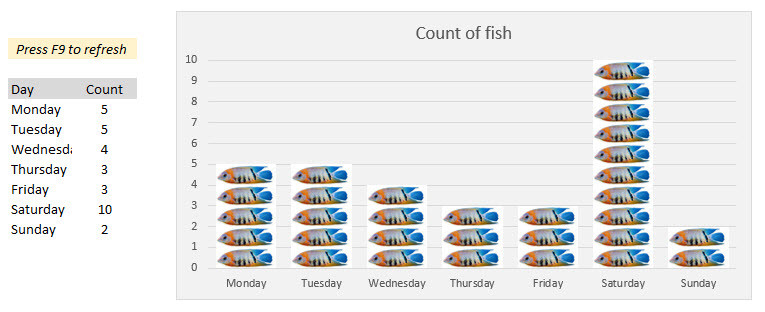
Hope this helps. The final chart looks like this:

Cheers
Harold
![]()
Hi Harold,
I will be stuck with playing around with this later this evening. Thanks for the tip.
/Anders
