Mynda
I am still early in your course but like it a lot. This may be covered in a session I have not reached yet but it is a pressing problem for me.
I have developed a dashboard with a large number of charts. The data for the charts is driven by a feed that pulls stock market data for 2 years and changes when I change the symbol. As stock prices can be extremely different (one stock may be $5 and another $100), when a symbol changes, the chart may be quite unreadable as the vertical access usually defaults to too low a number. This can be corrected by formatting the vertical axis and choosing the minimum and maximum values but as I have 22 stocks on the dashboard, it is a big job to change them all if I change a large number of the symbols.
Is there a way, other than through VBA, to have the vertical axis set to show the chart with the minimum and maximum values of the data range?
Sure is, Bob. It's called a ghost series (well that's what I call it anyway) and I cover it in session 4.19 of the Dashboard course.
Let me know if you get stuck.
Mynda
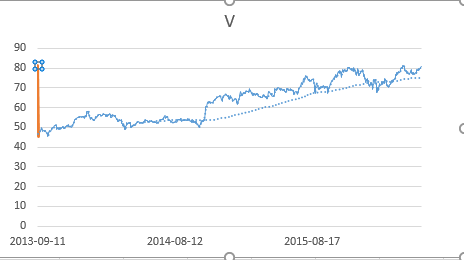
Is it possible that ghost series do not work in Excel 2016? When I add them, they do show on the chart but it does not influence the range of the vertical axis. Please see attached.
Also can you point me to the best place to improve the look of the horizontal date range?
By the way, I was calculating a 200 day moving average and seeing how to do it using trendlines was very helpful.
Or is it possibly a 32 vs 64 bit issue? I am running 64.
Hi Bob,
It won't have anything to do with Excel 2016 or 32 vs 64 bit. Your file isn't attached so I can't tell what's causing the issue etc. Please try uploading your file again and I'll take a look.
Thanks,
Mynda
Thanks. 
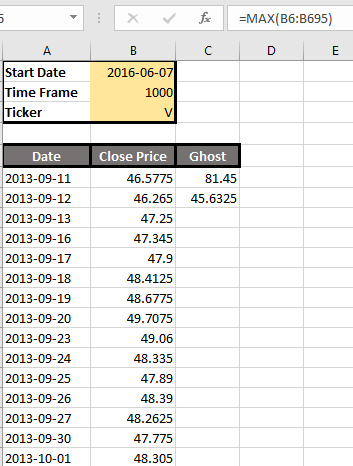
 Here is how the data is set up including the max and min in the ghost column. I really appreciate your help.
Hi Bob,
Why do you think the Ghost series isn't influencing the vertical axis range? Note: the ghost series must calculate the MIN from ALL of your chart's data, likewise the MAX. That is, if you have 22 charts then the MAX range must reference the data for all 22 charts so that it finds the absolute MAX and sets the axis height accordingly.
In session 4.01 I cover some options for horizontal axis labels, including nesting the labels. Probably easiest just to look at the Excel file for session 4 to see them.
If you get stuck it's best if you can send your Excel file to me. If it's confidential then you can email it to me direct.
Mynda
The min and max are calculating the proper values. On this dashboard, I have several charts but all have their own min and max. On the chart I sent you, the max is 81.45 and the min is 45.63. Before I change the plotted values to no line, it shows an orange line connecting the min and max at those values but it still has the vertical axis running from 0 to 90.
I am wondering if I am not properly explaining myself. My goal is for the chart to have the bottom of the vertical axis showing approximately 45 and the top 82 which I can achieve if I hard code the min and max at those levels. The problem is that these are stock charts and if the symbol changes, the min and max change, which is why I think your ghost suggestion is awesome. Unfortunately with the ghost values, the minimum seems to revert to zero.
Here is the spreadsheet.
Thanks for all your help.
Hi Bob,
I see now that it's actually the minimum value that you want to change up from zero. Unfortunately this isn't so easy as the calculation for how Excel decides when to change the minimum from zero is complex. So, you have 2 options:
Use Jon Peltier's VBA solution:
https://peltiertech.com/link-excel-chart-axis-scale-to-values-in-cells/
Use Tushar Mehta's free Add-in:
https://www.tushar-mehta.com/excel/software/autochart/index.html
I hope one of those is useful.
Mynda
Thanks for all your help. My plan is to take a VBA course so I will put this on my list of things to watch for. My hope was to find a quick solution and yours sounded great but it can wait if there isn't something simple. I learned a lot through this interaction and appreciate your prompt and insightful responses.
You're welcome, Bob. I recommend 2 VBA courses:
Allen Wyatt's VBA for beginners or Jon Acampora's VBA course, which starts with a free introductory course.
BTW, if you click on those links and join one of their courses then I'll recevie a few dollars, but that's not why I recommend them. There's actually not that much out there in the way of quality VBA courses and I would recommend these ones whether I got a commission or not.
Hope that helps.
Mynda
