Hi,
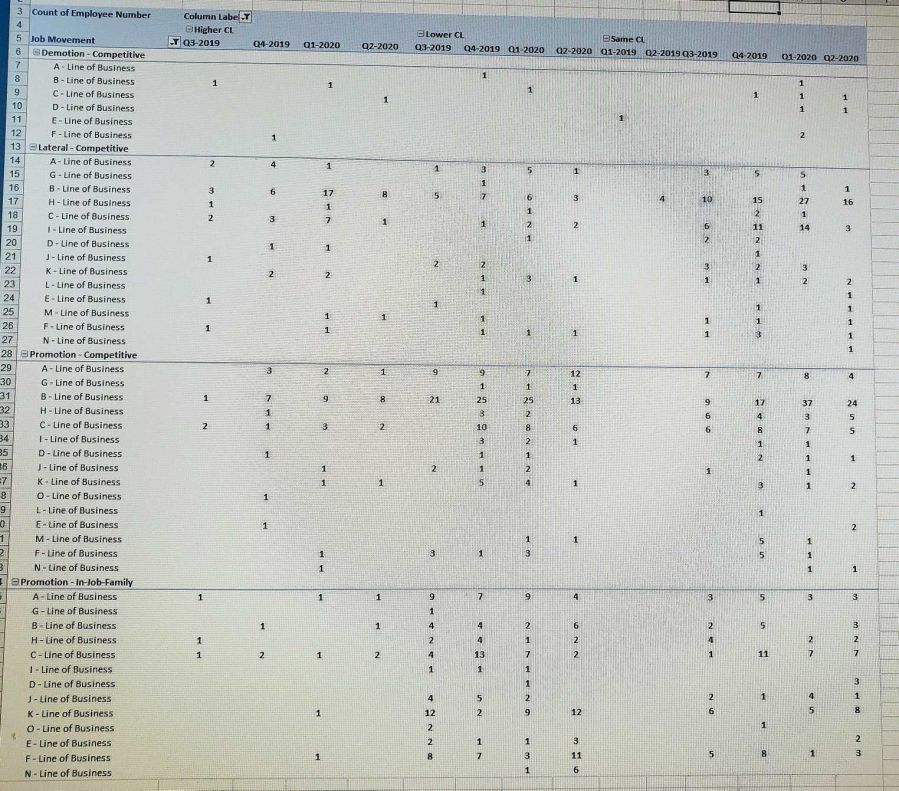
I need help on excel charts. I am trying to create a excel chart which shows trends for each Line of Business and Quarter over quarter for each job movement.
Can someone please advice which chart would depict this?
See attached the pic of my pivot table for which I need a chart.
Thanks.
Hima
Hi Hima,
Welcome to our forum! Please upload your picture again. You need to click the yellow 'start upload' button. That said, it would be far better if you can upload a sample Excel file so we can give you an example back, rather than just a verbal description.
Mynda
Thanks for the quick reply Mynda. The file size is bigger and unable to attach. Any other way I can show the data?
Hi Hima,
You can use a free OneDrive account to store the file then share the link to it
https://www.microsoft.com/en-au/microsoft-365/onedrive/online-cloud-storage
Regards
Phil
Or just create a sample file with a small amount of your data.
See attached the pic. Please advice. Thank you.

Hi Hima,
Move the Higher, Lower and Same CL to the row labels and then use Sparklines. There's too much data here to plot in a single chart. The other option is to use mini-charts. Session 5.13 of the new Dashboard course.
Mynda
