Hello team,
I hope you are doing safe.
Attached is the project management dashboard excel file; FYIP: I use excel 2016 and a Windows OS.
Background: I am developing a project management dashboard to track the start dates, end dates and the % completion of the project.
Problem: I am able to represent the start and end dates of a project in the conditional formatting bars, however, I am unable to find a way to represent the % of the project completed. FYIP: The % of project completion is independent of dates and is determined by a separate input which eventually shows up as %.
Question: Could you please help me in capturing the % of project completed in the conditional formatting bars?
Many thanks.
Hi Lalith,
Welcome to our forum!
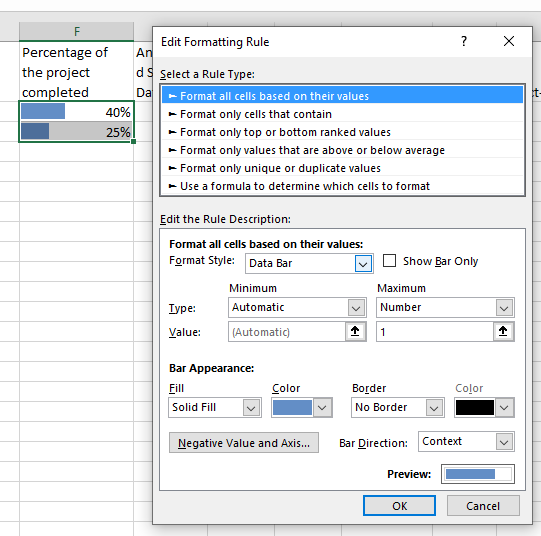
To apply conditional formatting bars to the percentages in column F (Percentage of the project completed), first select the cells you want the bars in > Home tab > Conditional Formatting > Data Bars.
Then edit the rule and in the Maximum drop down choose 'Number' and put a 1 in the 'Value' field.
Mynda
My apologies if my question was not clear.
What I actually want to achieve is the % completion of the project being represented within the blue bars (just below the calendar dates towards the right-side of the excel file).
Thank you.
Hi Lalith,
Can you give me an example of what you mean? e.g. do you want to see % values where you currently have 'x'? How is this percentage calculated? Please provide an example file that shows manually what you want to see.
Mynda
