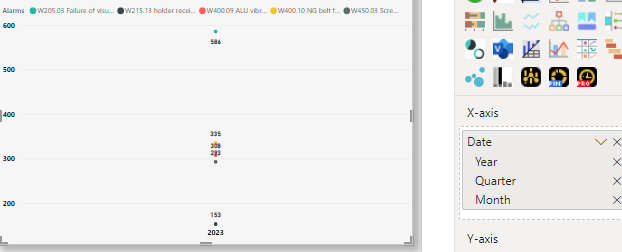
What lines are you expecting to see? You appear to have three separate series with only one data point in each, so there are no lines to draw - that's why all you see are the markers.
Hi David,
If you read the file called 'Read me first' that was included in the Zip file you downloaded from our site, you'll find the answer to the issue
Hint, it's a locale problem.
Mynda
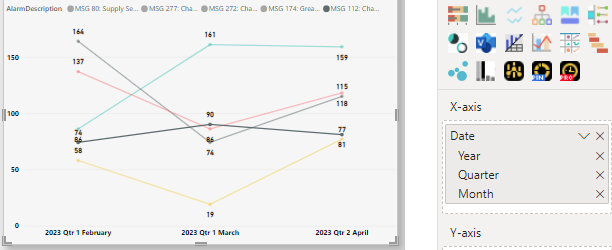
Hi. I'm having the same issue. The funny thing is it stays as lines after I set the date hierarchy, on the right visualization pane, to year, quarter, month. A day later, it will go back to vertical dots exactly the same as what OP here showed in his Dropbox. If I reset the date hierarchy, by changing it to date and then changing it back to date hierarchy, it will go back to lines as I wanted. It's very confusing and I'm encountering this issue everyday. What could be the problem? I've changed what @Mynda suggested, but the issue wasn't resolved.

Hi Rose,
The issue is that you haven't changed the date data type using 'change type using locale'. Please read the file called 'Read me first' that was included in the Zip file you downloaded from our site, you'll find the answer to the issue.
Mynda

