Data cleaning is one of the most time-consuming tasks for analysts. While Python is a powerful tool, it’s not always the most efficient choice for cleaning data. In this post, we’ll show you how Power Query in Excel can clean the same dataset 12x faster—with zero coding that’s 100% reusable.
The Challenge: Cleaning a Complex Survey Dataset
Shashank Kalanithi’s popular 1hr 17min YouTube tutorial that has been viewed over 3.5 million times demonstrates how to clean SurveyMonkey data using Python and Pandas. And while his method is correct, it’s a lot of time-consuming coding and debugging.
Using Excel’s Power Query, we can achieve the same transformation in just 5 minutes with zero coding, and it’s reusable, so next time it’ll be even faster!
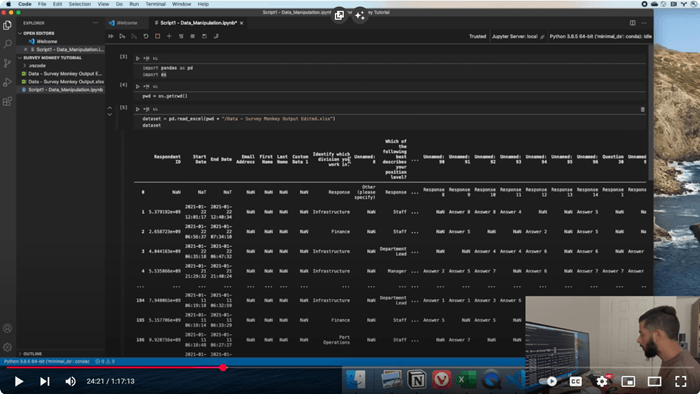
Shashank Kalanithi Data Cleaning with Python Video.
Table of Contents
- Watch the Power Query vs Python for Data Cleaning Video
- Get the Practice Data and Power Query Solution
- Understanding the Raw Data
- Step 1: Cleaning Headers with Power Query
- Step 2: Removing Unnecessary Columns
- Step 3: Unpivoting the Data
- Step 4: [optional] Calculating Respondent Counts
- Step 5: [optional] Merging Queries
- Step 6: Loading the Clean Data
- Step 7: Automate with One Click
- Why Choose Power Query Over Python?
Watch the Power Query vs Python for Data Cleaning Video

Get the Practice Data and Power Query Solution
Enter your email address below to download the sample workbook.

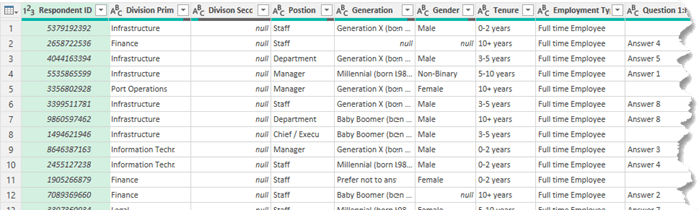
Understanding the Raw Data
Before we begin, let’s look at the challenges in the dataset:
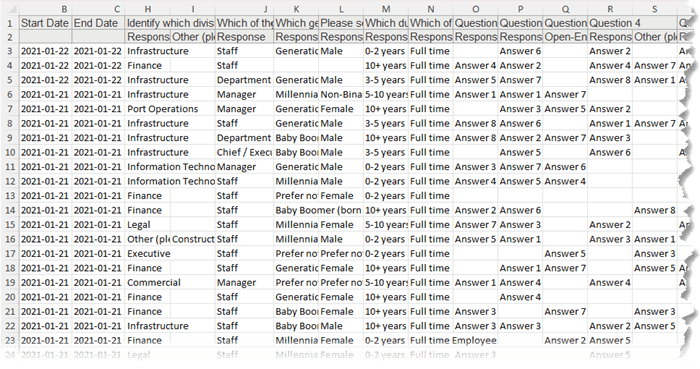
- Headers spread over two rows: The column headers are split over rows 1 and 2 and need to be combined.
- Multiple columns for each question: Each survey question is in a separate column (columns O:CV).
- Missing question numbers: Only the first response for each question contains a number (visible in column S in the image above).
- Empty columns: Some columns contain no useful data and need to be removed (not shown in screenshot).
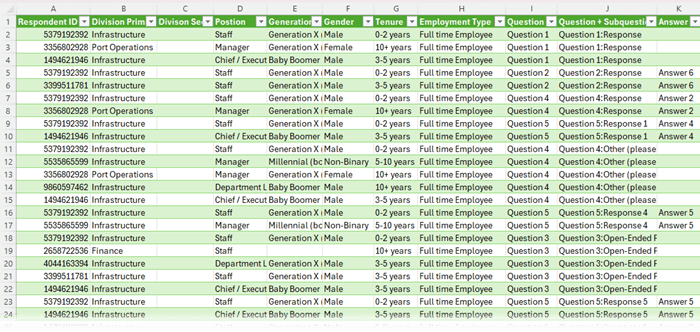
- Final desired layout (shown below): We need a tabular format, where each question and sub-question is a row, with additional columns for response counts (the last two columns are not visible in the screenshot below).
Step 1: Cleaning Headers with Power Query
Instead of using copy-paste and formulas like in Shashank’s method, Power Query makes this process much faster.
1. Load Data into Power Query
- Select cell A1 and press CTRL + A to select all data.
- Go to the Data tab and choose From Table/Range.

- At the Insert Table dialog box, uncheck “My table has headers” since headers span two rows.
2. Transpose and Fix Headers
- In the Power Query window, go to Transform > Transpose.
- Select Column1 and go to Transform tab > Fill Down to populate missing question numbers.
- Hold SHIFT and select Column1 & Column2 with a colon separator using Add Column > Merge Columns.
- Right-click the new column > Move to the beginning
- Delete Column 1 & Column 2 as these old heading columns are no longer required
- Transpose the data back
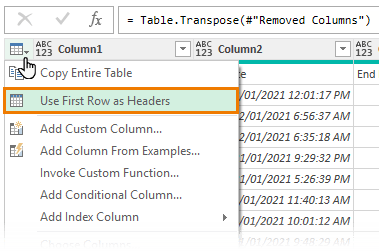
- Promote the first row to headers:
Step 2: Removing Unnecessary Columns
- Select unwanted columns (e.g., Start Date through to Custom Data 1).
- Press DELETE to remove them.
- Rename demographic columns for clarity (e.g., Division Primary, Division Secondary, Generation, Tenure & Employment Type).
Your query should now look like this:
Step 3: Unpivoting the Data
The raw survey data is in a wide format. To analyse it effectively, we need to convert it to a long or tabular format.
1. Replace Nulls with Blanks
- Select question columns.
- Use Transform > Replace Values to replace null with an empty string.
If we don’t take this step, any rows with null values will be removed in the next step.
2. Unpivot Questions
- Select the demographic columns (Hold SHIFT and left click Respondent ID to Employment Type).
- Right-click and choose Unpivot Other Columns.
- Add Column for the Question. Select Attribute column > Add Column > Extract > Text Before Delimiter. The delimiter is the colon.
- Rename Columns: Attribute = Question + Subquestion, Value = Answer and Text Before Delimiter = Question.
- [Optional] Rename query: Unpivoted Data
Now, each question and sub-question is in a single column, making analysis much easier. We could stop there and skip to step 6 and analyse the data using PivotTables and formulas, but Shashank’s client wanted two calculated columns added.
Step 4: [optional] Calculating Respondent Counts
Count Number of Respondents per Question
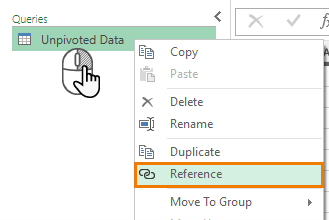
1. Reference the Unpivoted Data query.
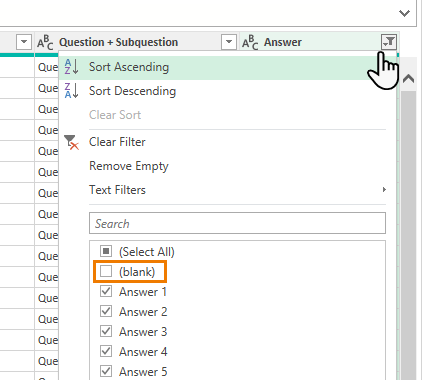
2. Filter out blank responses from the Answer column:
3. Select Respondent ID & Question (hold CTRL to select non-contiguous columns), then right-click > Remove Other Columns.
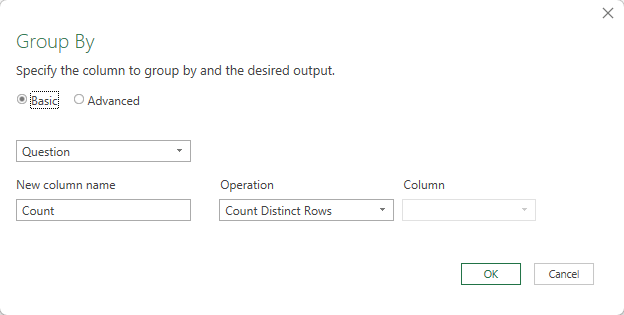
4. Select Question column, then Home tab > Group By > Count Distinct Rows.
5. Rename query: Number of Respondents.
Count Number of Respondents per Answer
- Reference the original query again.
- Filter out blank responses from the Answer column.
- Select Respondent ID, Question + Sub-question, and Answer (hold CTRL to select non-contiguous columns), then right-click > Remove Other Columns.
- Select Question + Sub-question, and Answer.
- Home tab > Group By (advanced) > Count Distinct Rows:
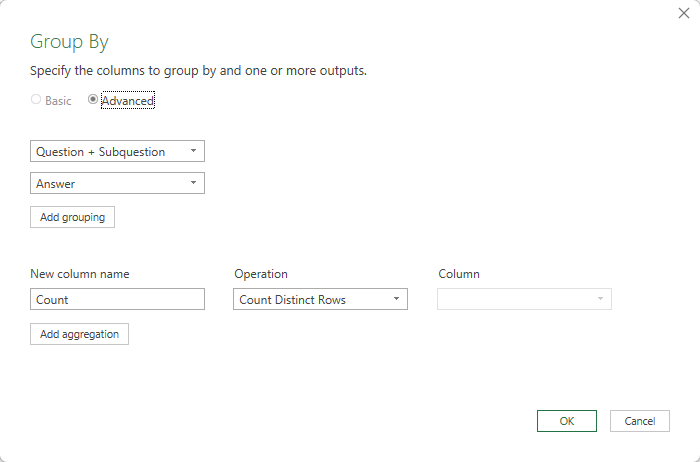
- Rename query: Same Answer Count.
Step 5: [optional] Merging Queries
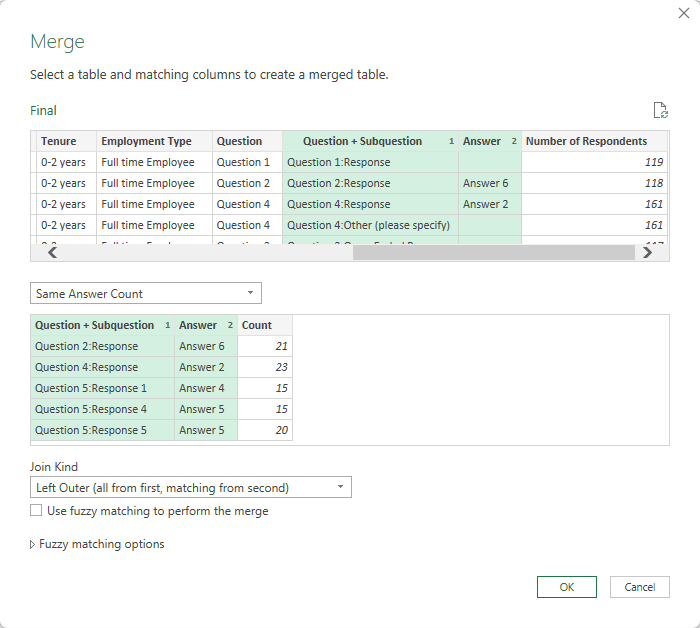
1. Merge the Unpivoted Data query with ‘Same Answer Count’.
- Select the Unpivoted Data query > Home tab > Merge Queries > As New
- Match Question + Sub-question and Answer.
- Use a Left Outer Join.
- Expand the merged column to bring in counts:
- Rename the column ‘Number of Respondents’.
- Rename the query ‘Final’.
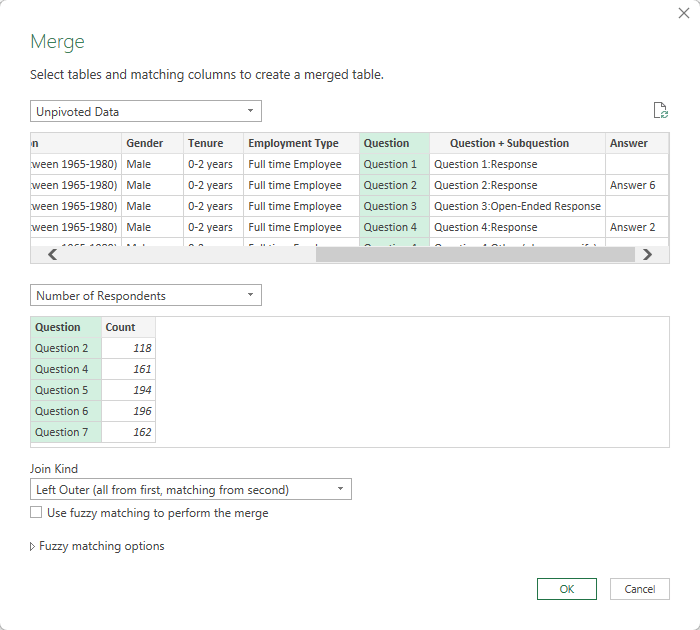
2. Merge this query with ‘Number of Respondents’.
- Home tab > Merge Queries
- Match Question and Answer columns (hold CTRL to select multiple columns to match).
- Use a Left Outer Join.
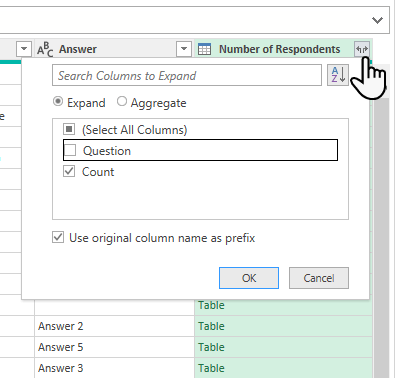
- Expand the column to bring in respondent counts:
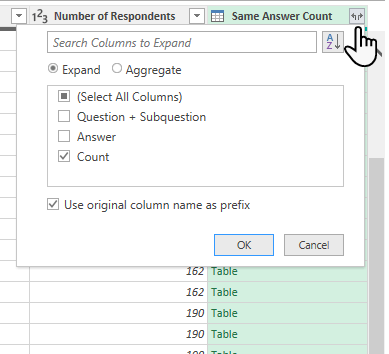
- Rename the merged column ‘Same Answer Count’.
Step 6: Loading the Clean Data
1. Close & Load To > Connection Only (for intermediate queries).
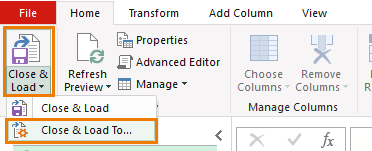
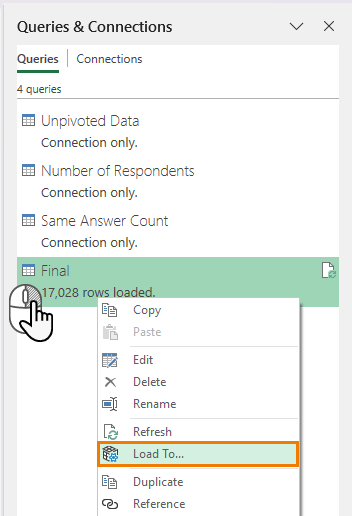
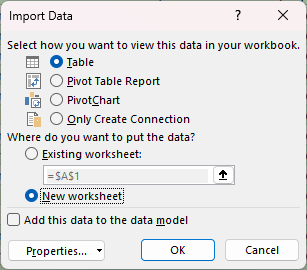
2. Edit Final Query > Load To >
3. Table in New Worksheet:
4. Verify the row count matches expectations.
Step 7: Automate with One Click
Power Query records every transformation step. If you receive new SurveyMonkey data, just make a copy of the file and paste in the new data over the top of the original data. Go to the Data tab > Refresh All, and Excel will apply the same cleaning process instantly—no coding required!
Why Choose Power Query Over Python?
- Faster: Reduce an hour of work to just 5 minutes.
- No Debugging: Avoid scripting errors and syntax issues.
- 100% Repeatable: Apply the same steps to new data with a single click.
Ready to master Power Query? Check out my comprehensive course here and automate your data workflows today!